2.2 Image Guide
This section introduces the 2htdp/image library
through a series of increasingly complex image constructions
and discusses some subtle details of cropping and outline
images.
2.2.1 Overlaying, Above, and Beside: A House
To build a simple-looking house, we can place a triangle above
a rectangle.
We can give the house two roofs by putting two triangles next to
each other.
But if we want the new roof to be a little smaller, then they do not line
up properly.
Instead, we can use beside/align to line up the two triangles
along their bottoms instead of along the middles (which is what
beside does).
|
|
| > victorian |

|
To add a door to the house, we can overlay a brown rectangle,
aligning it with the center bottom of the rest of the house.
We can use a similar technique to put a doorknob on the door, but instead of
overlaying the doorknob on the entire house, we can overlay it just on the
door.
2.2.2 Rotating and Overlaying: A Rotary Phone Dial
A rotary phone dial can be built by from a black disk and 10 little white ones
by placing the white disks, one at a time, at the top of the black disk and
then rotating the entire black disk. To get started, lets define a function
to make little white disks with numbers on them:
We’ll use place-and-turn to put the numbers onto the disk:
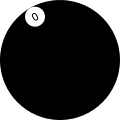
For example:
| > (place-and-turn | | 0 | | (circle 60 "solid" "black")) |
|
|
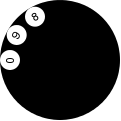
| > (place-and-turn | | 8 | | (place-and-turn | | 9 | | (place-and-turn | | 0 | | (circle 60 "solid" "black")))) |
|
|
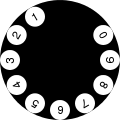
We can write a single function to put all of the numbers together into the dial:
| > (define (place-all-numbers dial) | | (place-and-turn | | 1 | | (place-and-turn | | 2 | | (place-and-turn | | 3 | | (place-and-turn | | 4 | | (place-and-turn | | 5 | | (place-and-turn | | 6 | | (place-and-turn | | 7 | | (place-and-turn | | 8 | | (place-and-turn | | 9 | | (place-and-turn | | 0 | | dial))))))))))) |
|
|
| > (place-all-numbers (circle 60 "solid" "black")) |
|
That definition is long and tedious to write. We can shorten it using
foldl:
| > (define (place-all-numbers dial) | | (foldl place-and-turn | | dial | | '(0 9 8 7 6 5 4 3 2 1))) |
|
|
| > (place-all-numbers (circle 60 "solid" "black")) |

|
To finish off the dial, we need to rotate it a little bit to its natural
position and put a white disk in the center of it. Here’s the inner dial:
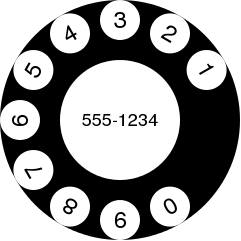
and here’s a function to build the entire rotary dial, with an argument
that scales the dial:
|
|
| > (rotary-dial 2) |
|
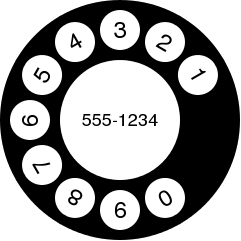
Looking at the image, it feels like the numbers are too close to the edge of
the dial. So we can adjust the place-and-turn function to put a little
black rectangle on top of each number. The rectangle is invisible because it
ends up on top of the black dial, but it does serve to push the digits down
a little.
|
|
| > (rotary-dial 2) |
|
2.2.3 Alpha Blending
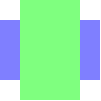
With shapes that have opaque colors like "red" and "blue",
overlaying one on top completely blots out the one one the bottom.
For example, the red rectangle here completely covers the blue one.
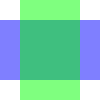
But 2htdp/image also supports colors that are not
completely opaque, via the (optional) fourth argument to color.
In this example, the color (color 0 255 0 127) looks just
like the color (color 127 255 127) when the background
is white. Since white is (color 255 255 255), we end up
getting 1/2 of 255 for the red and blue components
and 255 for the green one.
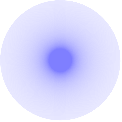
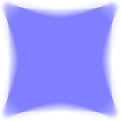
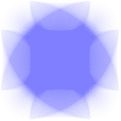
We can also use alpha blending to make some interesting effects.
For example, the function spin-alot takes an image argument
and repeatedly places it on top of itself, rotating it each time by
1 degree.
Here are some uses of spin-alot, first showing the original
shape and then the spun shape.
2.2.4 Recursive Image Functions
It is also possible to make interesting looking shapes with little recursive functions.
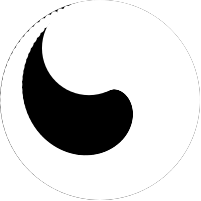
For example, this function repeatedly puts white circles that grow, evenly spaced around
the edge of the given shape:
| > (swoosh (circle 100 "solid" "black") | | 94) |
|
|
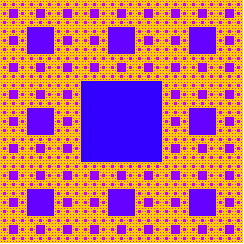
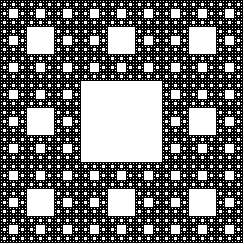
More conventional fractal shapes can also be written using the image
library, e.g.:
| > (sierpinski-carpet 5) |
|
We can adjust the carpet to add a little color:
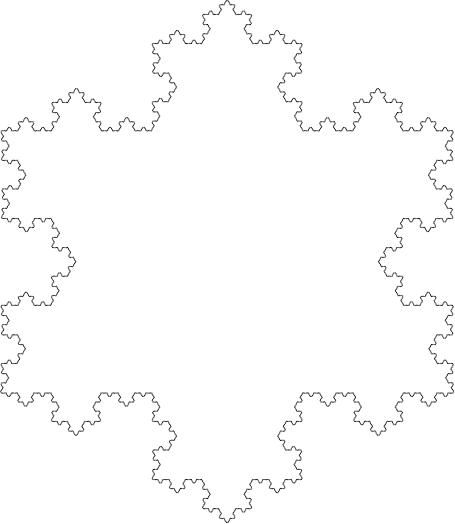
The Koch curve can be constructed by simply placing four
curves next to each other, rotated appropriately:
|
|
| > (koch-curve 5) |

|
And then put three of them together to form the Koch snowflake.
2.2.5 The Nitty Gritty of Pixels, Pens, and Lines
The image library treats coordinates as if they are in the upper-left corner
of each pixel, and infinitesimally small (unlike pixels which have some area).
Thus, when drawing a solid square of whose side-length is 10, the image library
colors in all of the pixels enclosed by the square starting at the upper
left corner of (0,0) and going down to the upper left corner of (10,10),
so the pixel whose upper left at (9,9) is colored in, but the pixel
at (10,10) is not. All told, 100 pixels get colored in, just as expected for
a square with a side length of 10.
When drawing lines, however, things get a bit more complex. Specifically,
imagine drawing the outline of that rectangle. Since the border is
between the pixels, there really isn’t a natural pixel to draw to indicate
the border. Accordingly, when drawing an outline square (without a
pen specification, but just a color as the last argument),
the image library uses a pen whose width is 1 pixel, but draws a line
centered at the point (0.5,0.5) that goes down and around to the point (10.5,10.5).
This means that the outline slightly exceeds the bounding box of the shape.
Specifically, the upper and left-hand lines around the square are within
the bounding box, but the lower and right-hand lines are just outside.
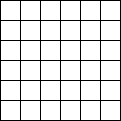
This kind of rectangle is useful when putting rectangles next to each other
and avoiding extra thick lines on the interior. For example, consider
building a grid like this:
The reason interior lines in this grid are the same thickness as the lines around the edge
is because the rectangles overlap with each other.
That is, the upper-left rectangle’s right edge is right on top of the
next rectangle’s left edge.
The special case of adding 0.5 to each coordinate when drawing the square
applies to all outline polygon-based shapes that just pass color,
but does not apply when a pen
is passed as the last argument to create the shape.
For example, if using a pen of thickness 2 to draw a rectangle, we get a
shape that has a border drawing the row of pixels just inside and just outside
the shape. One might imagine that a pen of thickness 1 would draw an outline around the shape with
a 1 pixel thick line, but this would require 1/2 of each pixel to be illuminated, something
that is not possible. Instead, the same pixels are lit up as with the 2 pixel wide pen, but
with only 1/2 of the intensity of the color. So a 1 pixel wide black pen object draws
a 2 pixel wide outline, but in gray.
When combining pens and cropping, we can make a rectangle that has a line that is one pixel
wide, but where the line is drawn entirely within the rectangle. This rectangle has a two-pixel wide
black pen, but we can crop out the outer portion of the pen.
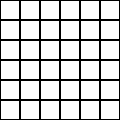
Using that we can build a grid now too, but this grid has doubled lines on the
interior.
While this kind of rectangle is not useful for building grids, it
is important to be able to build rectangles whose drawing does not
exceed its bounding box. Specifically, this kind of drawing is used
by frame and empty-scene so that the extra drawn pixels
are not lost if the image is later clipped to its bounding box.
When using image->color-list with outline shapes, the results
can be surprising for the same reasons. For example, a
2x2 black, outline rectangle consists of nine black pixels, as discussed above,
but since image->color-list only returns the pixels that are
within the bounding box, we see only three black pixels and one white one.
|
(list | (color 0 0 0 255) | (color 0 0 0 255) | (color 0 0 0 255) | (color 255 255 255 0)) |
|
The black pixels are (most of) the upper and left edge of the outline shape,
and the one white pixel is the pixel in the middle of the shape.


