9 Plot and Renderer Parameters
9.1 Compatibility
parameter
(plot-deprecation-warnings? warnings?) → void? warnings? : boolean?
=
#f
9.2 Output
parameter
(plot-new-window? window?) → void? window? : boolean?
=
#f
Users of command-line Racket, which cannot display image snips, should enter(plot-new-window? #t)
parameter
(plot-width width) → void? width : exact-positive-integer?
=
400
parameter
(plot-height height) → void? height : exact-positive-integer?
=
400
The width and height of a plot, in logical drawing units (e.g. pixels for bitmap plots).
parameter
(plot-jpeg-quality) → (integer-in 0 100)
(plot-jpeg-quality quality) → void? quality : (integer-in 0 100)
=
100
parameter
(plot-ps/pdf-interactive? interactive?) → void? interactive? : boolean?
=
#f
If #t, plot-file and plot3d-file open a dialog when writing PostScript or PDF files. See post-script-dc% and pdf-dc%.
9.3 General Appearance
parameter
(plot-foreground color) → void? color : plot-color/c
=
0
parameter
(plot-background color) → void? color : plot-color/c
=
0
The plot foreground and background color. That both are 0 by default is not a mistake: for foreground colors, 0 is interpreted as black; for background colors, 0 is interpreted as white. See ->pen-color and ->brush-color for details on how PLoT interprets integer colors.
parameter
(plot-foreground-alpha) → (real-in 0 1)
(plot-foreground-alpha alpha) → void? alpha : (real-in 0 1)
=
1
parameter
(plot-background-alpha) → (real-in 0 1)
(plot-background-alpha alpha) → void? alpha : (real-in 0 1)
=
1
The opacity of the background and foreground colors.
parameter
(plot-font-size) → (>=/c 0)
(plot-font-size size) → void? size : (>=/c 0)
=
11
The font size of the title, axis labels, tick labels, and other labels, in drawing units.
parameter
(plot-font-family family) → void? family : font-family/c
=
'roman
The font family used for the title and labels.
parameter
(plot-line-width) → (>=/c 0)
(plot-line-width width) → void? width : (>=/c 0)
=
1
The width of axis lines and major tick lines. (Minor tick lines are half this width.)
parameter
(plot-legend-anchor anchor) → void? anchor : anchor/c
=
'top-left
Controls the placement of the legend.
parameter
(plot-legend-box-alpha) → (real-in 0 1)
(plot-legend-box-alpha alpha) → void? alpha : (real-in 0 1)
=
2/3
The opacity of the filled rectangle behind the legend entries.
parameter
(plot-tick-size) → (>=/c 0)
(plot-tick-size size) → void? size : (>=/c 0)
=
10
The length of tick lines, in drawing units.
parameter
(plot-title) → (or/c string? #f)
(plot-title title) → void? title : (or/c string? #f)
=
#f
parameter
(plot-x-label) → (or/c string? #f)
(plot-x-label label) → void? label : (or/c string? #f)
=
"x axis"
parameter
(plot-y-label) → (or/c string? #f)
(plot-y-label label) → void? label : (or/c string? #f)
=
"y axis"
parameter
(plot-z-label) → (or/c string? #f)
(plot-z-label label) → void? label : (or/c string? #f)
=
#f
The title and axis labels. A #f value means the label is not drawn and takes no space. A "" value effectively means the label is not drawn, but it takes space.
parameter
(plot-x-far-label) → (or/c string? #f)
(plot-x-far-label label) → void? label : (or/c string? #f)
=
#f
parameter
(plot-y-far-label) → (or/c string? #f)
(plot-y-far-label label) → void? label : (or/c string? #f)
=
#f
parameter
(plot-z-far-label) → (or/c string? #f)
(plot-z-far-label label) → void? label : (or/c string? #f)
=
#f
The axis labels for “far” axes. See plot-x-ticks for a discussion of near and far axes.
parameter
(plot-x-tick-label-anchor anchor) → void? anchor : anchor/c
=
'top
parameter
(plot-x-tick-label-angle angle) → void? angle : real?
=
0
parameter
(plot-y-tick-label-anchor anchor) → void? anchor : anchor/c
=
'right
parameter
(plot-y-tick-label-angle angle) → void? angle : real?
=
0
parameter
(plot-x-far-tick-label-anchor anchor) → void? anchor : anchor/c
=
'bottom
parameter
(plot-x-far-tick-label-angle angle) → void? angle : real?
=
0
parameter
(plot-y-far-tick-label-anchor anchor) → void? anchor : anchor/c
=
'left
parameter
(plot-y-far-tick-label-angle angle) → void? angle : real?
=
0
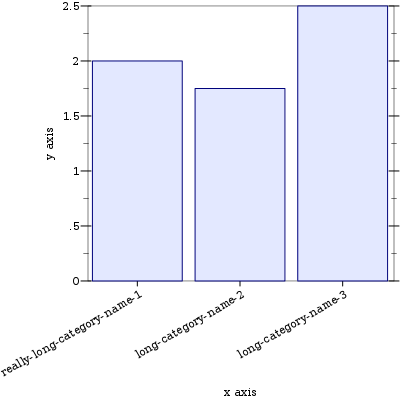
Anchor and angles for axis tick labels (2D only). Angles are in degrees. The anchor refers to the part of the label attached to the end of the tick line.Set these when labels would otherwise overlap; for example, in histograms with long category names.
> (parameterize ([plot-x-tick-label-anchor 'top-right] [plot-x-tick-label-angle 30]) (plot (discrete-histogram '(#(really-long-category-name-1 2) #(long-category-name-2 1.75) #(long-category-name-3 2.5)))))
parameter
(plot-x-axis?) → boolean?
(plot-x-axis? axis?) → void? axis? : boolean?
=
#t
parameter
(plot-x-far-axis? axis?) → void? axis? : boolean?
=
#t
parameter
(plot-y-axis?) → boolean?
(plot-y-axis? axis?) → void? axis? : boolean?
=
#t
parameter
(plot-y-far-axis? axis?) → void? axis? : boolean?
=
#t
parameter
(plot-z-axis?) → boolean?
(plot-z-axis? axis?) → void? axis? : boolean?
=
#t
parameter
(plot-z-far-axis? axis?) → void? axis? : boolean?
=
#t
When any of these is #f, the corresponding axis is not drawn.Use these along with x-axis and y-axis if you want axes that intersect the origin or some other point.
parameter
(plot-animating? animating?) → void? animating? : boolean?
=
#f
When #t, certain renderers draw simplified plots to speed up drawing. PLoT sets it to #t, for example, when a user is clicking and dragging a 3D plot to rotate it.
procedure
(animated-samples samples) → (and/c exact-integer? (>=/c 2))
samples : (and/c exact-integer? (>=/c 2))
=
(cond [(plot-animating?) (max 2 (ceiling (* 1/4 samples)))] [else samples]) Given a number of samples, returns the number of samples to use. This returns samples when plot-animating? is #f.
parameter
(plot-decorations? decorations?) → void? decorations? : boolean?
=
#t
When #f, axes, axis labels, ticks, tick labels, and the title are not drawn.
9.4 Lines
parameter
(line-samples) → (and/c exact-integer? (>=/c 2))
(line-samples samples) → void? samples : (and/c exact-integer? (>=/c 2))
=
500
parameter
(line-color color) → void? color : plot-color/c
=
1
parameter
(line-width) → (>=/c 0)
(line-width width) → void? width : (>=/c 0)
=
1
parameter
(line-style style) → void? style : plot-pen-style/c
=
'solid
parameter
(line-alpha) → (real-in 0 1)
(line-alpha alpha) → void? alpha : (real-in 0 1)
=
1
9.5 Intervals
parameter
(interval-color color) → void? color : plot-color/c
=
3
parameter
(interval-style style) → void? style : plot-brush-style/c
=
'solid
parameter
(interval-line1-color color) → void? color : plot-color/c
=
3
parameter
(interval-line1-width) → (>=/c 0)
(interval-line1-width width) → void? width : (>=/c 0)
=
1
parameter
(interval-line1-style style) → void? style : plot-pen-style/c
=
'solid
parameter
(interval-line2-color color) → void? color : plot-color/c
=
3
parameter
(interval-line2-width) → (>=/c 0)
(interval-line2-width width) → void? width : (>=/c 0)
=
1
parameter
(interval-line2-style style) → void? style : plot-pen-style/c
=
'solid
parameter
(interval-alpha) → (real-in 0 1)
(interval-alpha alpha) → void? alpha : (real-in 0 1)
=
3/4
9.6 Points
parameter
(point-sym) → point-sym/c
(point-sym sym) → void? sym : point-sym/c
=
'circle
parameter
(point-color color) → void? color : plot-color/c
=
0
parameter
(point-size) → (>=/c 0)
(point-size size) → void? size : (>=/c 0)
=
6
parameter
(point-line-width) → (>=/c 0)
(point-line-width width) → void? width : (>=/c 0)
=
1
parameter
(point-alpha) → (real-in 0 1)
(point-alpha alpha) → void? alpha : (real-in 0 1)
=
1
9.7 Vector Fields
parameter
(vector-field-samples samples) → void? samples : exact-positive-integer?
=
20
parameter
(vector-field-color color) → void? color : plot-color/c
=
1
parameter
(vector-field-line-width) → (>=/c 0)
(vector-field-line-width width) → void? width : (>=/c 0)
=
2/3
parameter
(vector-field-line-style style) → void? style : plot-pen-style/c
=
'solid
parameter
→ (or/c real? (one-of/c 'auto 'normalized)) (vector-field-scale scale) → void? scale : (or/c real? (one-of/c 'auto 'normalized))
=
'auto
parameter
(vector-field-alpha) → (real-in 0 1)
(vector-field-alpha alpha) → void? alpha : (real-in 0 1)
=
1
parameter
(vector-field3d-samples samples) → void? samples : exact-positive-integer?
=
9
9.8 Error Bars
parameter
(error-bar-width) → (>=/c 0)
(error-bar-width width) → void? width : (>=/c 0)
=
6
parameter
(error-bar-color color) → void? color : plot-color/c
=
0
parameter
(error-bar-line-width) → (>=/c 0)
(error-bar-line-width width) → void? width : (>=/c 0)
=
1
parameter
(error-bar-line-style style) → void? style : plot-pen-style/c
=
'solid
parameter
(error-bar-alpha) → (real-in 0 1)
(error-bar-alpha alpha) → void? alpha : (real-in 0 1)
=
2/3
9.9 Contours and Contour Intervals
procedure
(default-contour-colors zs) → (listof plot-color/c)
zs : (listof real?)
=
(color-seq* (list (->pen-color 5) (->pen-color 0) (->pen-color 1)) (length zs))
procedure
(default-contour-fill-colors z-ivls) → (listof plot-color/c)
z-ivls : (listof ivl?)
=
(color-seq* (list (->brush-color 5) (->brush-color 0) (->brush-color 1)) (length z-ivls))
parameter
(contour-samples) → (and/c exact-integer? (>=/c 2))
(contour-samples samples) → void? samples : (and/c exact-integer? (>=/c 2))
=
51
parameter
→ (or/c 'auto exact-positive-integer? (listof real?)) (contour-levels levels) → void? levels : (or/c 'auto exact-positive-integer? (listof real?))
=
'auto
parameter
(contour-colors) → (plot-colors/c (listof real?))
(contour-colors colors) → void? colors : (plot-colors/c (listof real?))
=
parameter
(contour-widths) → (pen-widths/c (listof real?))
(contour-widths widths) → void? widths : (pen-widths/c (listof real?))
=
'(1)
parameter
(contour-styles) → (plot-pen-styles/c (listof real?))
(contour-styles styles) → void? styles : (plot-pen-styles/c (listof real?))
=
'(solid long-dash)
parameter
(contour-alphas) → (alphas/c (listof real?))
(contour-alphas alphas) → void? alphas : (alphas/c (listof real?))
=
'(1)
parameter
(contour-interval-colors colors) → void? colors : (plot-colors/c (listof ivl?))
=
parameter
→ (plot-brush-styles/c (listof ivl?)) (contour-interval-styles styles) → void? styles : (plot-brush-styles/c (listof ivl?))
=
'(solid)
parameter
(contour-interval-alphas) → (alphas/c (listof ivl?))
(contour-interval-alphas alphas) → void? alphas : (alphas/c (listof ivl?))
=
'(1)
9.10 Rectangles
parameter
(rectangle-color color) → void? color : plot-color/c
=
3
parameter
(rectangle-style style) → void? style : plot-brush-style/c
=
'solid
parameter
(rectangle-line-color color) → void? color : plot-color/c
=
3
parameter
(rectangle-line-width) → (>=/c 0)
(rectangle-line-width width) → void? width : (>=/c 0)
=
1
parameter
(rectangle-line-style style) → void? style : plot-pen-style/c
=
'solid
parameter
(rectangle-alpha) → (real-in 0 1)
(rectangle-alpha alpha) → void? alpha : (real-in 0 1)
=
1
parameter
(rectangle3d-line-width) → (>=/c 0)
(rectangle3d-line-width width) → void? width : (>=/c 0)
=
1/3
parameter
(discrete-histogram-gap) → (real-in 0 1)
(discrete-histogram-gap gap) → void? gap : (real-in 0 1)
=
1/8
parameter
(discrete-histogram-skip) → (>=/c 0)
(discrete-histogram-skip skip) → void? skip : (>=/c 0)
=
1
parameter
(discrete-histogram-invert? invert?) → void? invert? : boolean?
=
#f
parameter
(stacked-histogram-alphas alphas) → void? alphas : (alphas/c nat/c)
=
'(1)
parameter
(stacked-histogram-colors colors) → void? colors : (plot-colors/c nat/c)
=
(λ (n) (build-list n add1))
parameter
(stacked-histogram-line-colors colors) → void? colors : (plot-colors/c nat/c)
=
parameter
(stacked-histogram-line-styles styles) → void? styles : (plot-pen-styles/c nat/c)
=
'(solid)
parameter
(stacked-histogram-line-widths widths) → void? widths : (pen-widths/c nat/c)
=
'(1)
parameter
(stacked-histogram-styles styles) → void? styles : (plot-brush-styles/c nat/c)
=
'(solid)
9.11 Decorations
These parameters do not control the typical appearance of plots. Instead, they control the look of renderers that add specific decorations, such as labeled points.
parameter
(x-axis-alpha) → (real-in 0 1)
(x-axis-alpha alpha) → void? alpha : (real-in 0 1)
=
1
parameter
(y-axis-alpha) → (real-in 0 1)
(y-axis-alpha alpha) → void? alpha : (real-in 0 1)
=
1
parameter
(z-axis-alpha) → (real-in 0 1)
(z-axis-alpha alpha) → void? alpha : (real-in 0 1)
=
1
parameter
(x-axis-far?) → boolean?
(x-axis-far? far?) → void? far? : boolean?
=
#f
parameter
(y-axis-far?) → boolean?
(y-axis-far? far?) → void? far? : boolean?
=
#f
parameter
(z-axis-far?) → boolean?
(z-axis-far? far?) → void? far? : boolean?
=
#f
parameter
(x-axis-ticks? ticks?) → void? ticks? : boolean?
=
#t
parameter
(y-axis-ticks? ticks?) → void? ticks? : boolean?
=
#t
parameter
(z-axis-ticks? ticks?) → void? ticks? : boolean?
=
#t
parameter
(x-axis-labels? labels?) → void? labels? : boolean?
=
#f
parameter
(y-axis-labels? labels?) → void? labels? : boolean?
=
#f
parameter
(z-axis-labels? labels?) → void? labels? : boolean?
=
#f
parameter
(polar-axes-number number) → void? number : exact-nonnegative-integer?
=
12
parameter
(polar-axes-alpha) → (real-in 0 1)
(polar-axes-alpha alpha) → void? alpha : (real-in 0 1)
=
1/2
parameter
(polar-axes-ticks? ticks?) → void? ticks? : boolean?
=
#t
parameter
(polar-axes-labels? labels?) → void? labels? : boolean?
=
#t
parameter
(label-anchor) → anchor/c
(label-anchor anchor) → void? anchor : anchor/c
=
'left
parameter
(label-angle) → real?
(label-angle angle) → void? angle : real?
=
0
parameter
(label-alpha) → (real-in 0 1)
(label-alpha alpha) → void? alpha : (real-in 0 1)
=
1
parameter
(label-point-size) → (>=/c 0)
(label-point-size size) → void? size : (>=/c 0)
=
4
9.12 3D General Appearance
parameter
(plot3d-samples) → (and/c exact-integer? (>=/c 2))
(plot3d-samples samples) → void? samples : (and/c exact-integer? (>=/c 2))
=
41
parameter
(plot3d-angle) → real?
(plot3d-angle angle) → void? angle : real?
=
30
parameter
(plot3d-altitude) → real?
(plot3d-altitude altitude) → void? altitude : real?
=
60
parameter
(plot3d-ambient-light) → (real-in 0 1)
(plot3d-ambient-light light) → void? light : (real-in 0 1)
=
2/3
parameter
(plot3d-diffuse-light? light?) → void? light? : boolean?
=
#t
parameter
(plot3d-specular-light? light?) → void? light? : boolean?
=
#t
9.13 Surfaces
parameter
(surface-color color) → void? color : plot-color/c
=
0
parameter
(surface-style style) → void? style : plot-brush-style/c
=
'solid
parameter
(surface-line-color color) → void? color : plot-color/c
=
0
parameter
(surface-line-width) → (>=/c 0)
(surface-line-width width) → void? width : (>=/c 0)
=
1/3
parameter
(surface-line-style style) → void? style : plot-pen-style/c
=
'solid
parameter
(surface-alpha) → (real-in 0 1)
(surface-alpha alpha) → void? alpha : (real-in 0 1)
=
1
9.14 Contour Surfaces
Contour surface renderers use shared contour parameters except for the following three.
parameter
(contour-interval-line-colors) → (plot-colors/c (listof ivl?))
(contour-interval-line-colors colors) → void? colors : (plot-colors/c (listof ivl?))
=
'(0)
parameter
(contour-interval-line-widths) → (pen-widths/c (listof ivl?))
(contour-interval-line-widths widths) → void? widths : (pen-widths/c (listof ivl?))
=
'(1/3)
parameter
→ (plot-pen-styles/c (listof ivl?)) (contour-interval-line-styles styles) → void? styles : (plot-pen-styles/c (listof ivl?))
=
'(solid)
9.15 Isosurfaces
Single isosurfaces (isosurface3d) use surface parameters. Nested isosurfaces (isosurfaces3d) use the following.
procedure
(default-isosurface-colors zs) → (listof plot-color/c)
zs : (listof real?)
=
(color-seq* (list (->brush-color 5) (->brush-color 0) (->brush-color 1)) (length zs))
procedure
zs : (listof real?)
=
(color-seq* (list (->pen-color 5) (->pen-color 0) (->pen-color 1)) (length zs))
parameter
→ (or/c 'auto exact-positive-integer? (listof real?)) (isosurface-levels levels) → void? levels : (or/c 'auto exact-positive-integer? (listof real?))
=
'auto
parameter
(isosurface-colors) → (plot-colors/c (listof real?))
(isosurface-colors colors) → void? colors : (plot-colors/c (listof real?))
=
parameter
(isosurface-styles styles) → void? styles : (plot-brush-styles/c (listof real?))
=
'(solid)
parameter
(isosurface-line-colors colors) → void? colors : (plot-colors/c (listof real?))
=
parameter
(isosurface-line-widths widths) → void? widths : (pen-widths/c (listof real?))
=
'(1/3)
parameter
(isosurface-line-styles) → (plot-pen-styles/c (listof real?))
(isosurface-line-styles styles) → void? styles : (plot-pen-styles/c (listof real?))
=
'(solid)
parameter
(isosurface-alphas) → (alphas/c (listof real?))
(isosurface-alphas alphas) → void? alphas : (alphas/c (listof real?))
=
'(1/2)