7 Plot Utilities
| (require plot/utils) | package: plot-lib |
| (require plot/typed/utils) | |
7.1 Formatting
procedure
(digits-for-range x-min x-max [ base extra-digits]) → exact-integer? x-min : real? x-max : real? base : (and/c exact-integer? (>=/c 2)) = 10 extra-digits : exact-integer? = 3
Examples: | ||||
|
procedure
(real->plot-label x digits [scientific?]) → any
x : real? digits : exact-integer? scientific? : boolean? = #t
Examples: | ||||||||||
|
procedure
(ivl->plot-label i [extra-digits]) → string?
i : ivl? extra-digits : exact-integer? = 3
Examples: | ||||
|
procedure
(->plot-label a [digits]) → string?
a : any/c digits : exact-integer? = 7
procedure
(real->string/trunc x e) → string?
x : real? e : exact-integer?
procedure
(real->decimal-string* x min-digits [ max-digits]) → string? x : real? min-digits : exact-nonnegative-integer? max-digits : exact-nonnegative-integer? = min-digits
Examples: | ||||||
|
procedure
(integer->superscript x) → string?
x : exact-integer?
Example: | ||
|
7.2 Sampling
procedure
(linear-seq start end num [ #:start? start? #:end? end?]) → (listof real?) start : real? end : real? num : exact-nonnegative-integer? start? : boolean? = #t end? : boolean? = #t
This function is used internally to generate sample points.
Examples: | |||||||||||||
|
procedure
(linear-seq* points num [ #:start? start? #:end? end?]) → (listof real?) points : (listof real?) num : exact-nonnegative-integer? start? : boolean? = #t end? : boolean? = #t
Examples: | ||||||
|
procedure
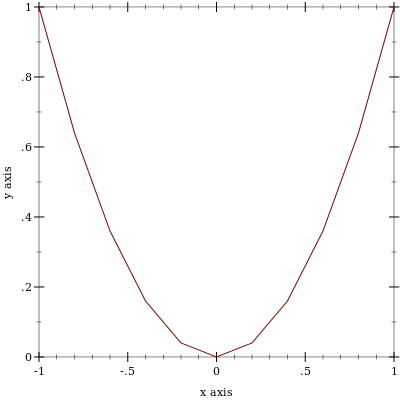
(nonlinear-seq start end num transform [ #:start? start? #:end? end?]) → (listof real?) start : real? end : real? num : exact-nonnegative-integer? transform : axis-transform/c start? : boolean? = #t end? : boolean? = #t
Examples: | ||||||||
|
struct
(struct mapped-function (f fmap) #:extra-constructor-name make-mapped-function) f : (any/c . -> . any/c) fmap : ((listof any/c) . -> . (listof any/c))
With some functions, mapping over a list can be done much more quickly if done specially. (An example is a piecewise function with many pieces that first must decide which interval its input belongs to. Deciding that for many inputs can be done more efficiently by sorting all the inputs first.) Renderer-producing functions that accept a (-> real? real?) also accept a mapped-function, and use its fmap to sample more efficiently.
procedure
(kde xs h) →
mapped-function? (or/c rational? #f) (or/c rational? #f) xs : (listof real?) h : real?
7.3 Plot Colors and Styles
procedure
(color-seq c1 c2 num [ #:start? start? #:end? end?]) → (listof (list/c real? real? real?)) c1 : color/c c2 : color/c num : exact-nonnegative-integer? start? : boolean? = #t end? : boolean? = #t
Example: | |||||
|
procedure
(color-seq* colors num [ #:start? start? #:end? end?]) → (listof (list/c real? real? real?)) colors : (listof color/c) num : exact-nonnegative-integer? start? : boolean? = #t end? : boolean? = #t
Example: | |||||
|
Symbols are converted to strings, and strings are looked up in a color-database<%>. Lists are unchanged, and color% objects are converted straightforwardly.
Examples: | ||||||||
|
This function does not convert integers to RGB triplets, because there is no way for it to know whether the color will be used for a pen or for a brush. Use ->pen-color and ->brush-color to convert integers.
procedure
(->pen-color c) → (list/c real? real? real?)
c : plot-color/c
Non-integer colors are converted using ->color. Integer colors are chosen for good pairwise contrast, especially between neighbors. Integer colors repeat starting with 128.
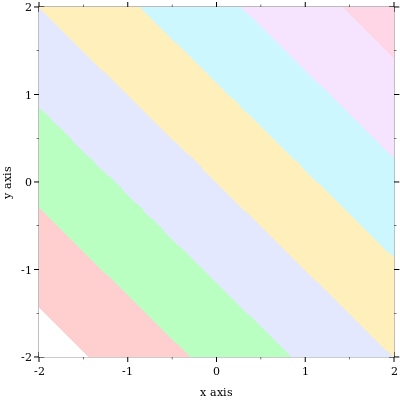
Examples: | ||||||||
|
procedure
(->brush-color c) → (list/c real? real? real?)
c : plot-color/c
Non-integer colors are converted using ->color. Integer colors are chosen for good pairwise contrast, especially between neighbors. Integer colors repeat starting with 128.
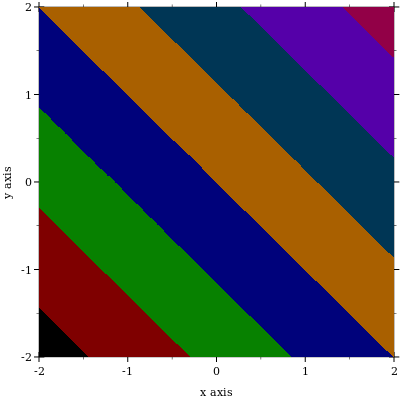
Examples: | ||||||||
|
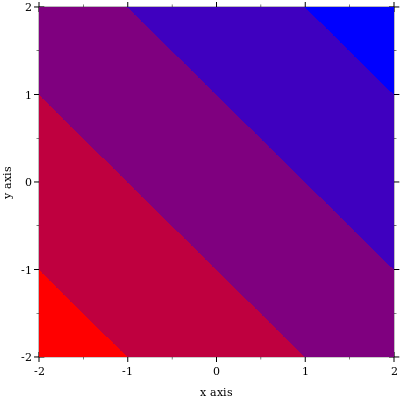
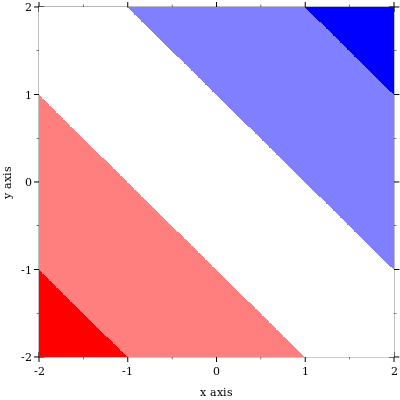
In the above example, mapping ->brush-color over the list is actually unnecessary, because contour-intervals uses ->brush-color internally to convert fill colors.
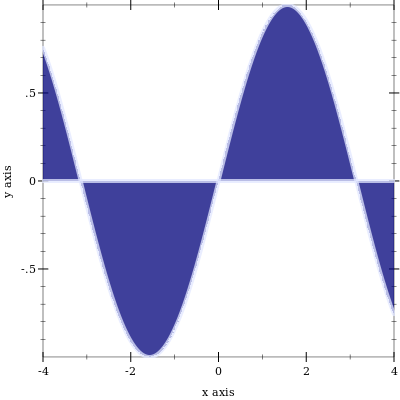
> (plot (function-interval sin (λ (x) 0) -4 4 #:color (->pen-color 3) #:line1-color (->brush-color 3) #:line2-color (->brush-color 3) #:line1-width 4 #:line2-width 4))
procedure
(->pen-style s) → symbol?
s : plot-pen-style/c
Examples: | ||||
|
procedure
(->brush-style s) → symbol?
s : plot-brush-style/c
Examples: | ||||||
|
7.4 Plot-Specific Math
7.4.1 Real Functions
procedure
(3d-polar->3d-cartesian θ ρ r) → (vector/c real? real? real?)
θ : real? ρ : real? r : real?
procedure
(ceiling-log/base b x) → exact-integer?
b : (and/c exact-integer? (>=/c 2)) x : (>/c 0)
Examples: | ||||||||
|
procedure
(floor-log/base b x) → exact-integer?
b : (and/c exact-integer? (>=/c 2)) x : (>/c 0)
Examples: | ||||||||
|
procedure
(maybe-inexact->exact x) → (or/c rational? #f)
x : (or/c rational? #f)
7.4.2 Vector Functions
Examples: | ||||||||||
|
Examples: | ||||||
|
procedure
(vnormalize v) → (vectorof real?)
v : (vectorof real?)
Examples: | ||||||
|
Example: | ||
|
procedure
(vrational? v) → boolean?
v : (vectorof real?)
Examples: | ||||||
|
7.4.3 Intervals and Interval Functions
> (ivl -inf.0 0) (ivl -inf.0 0)
> (ivl 0 +inf.0) (ivl 0 +inf.0)
> (ivl -inf.0 +inf.0) (ivl -inf.0 +inf.0)
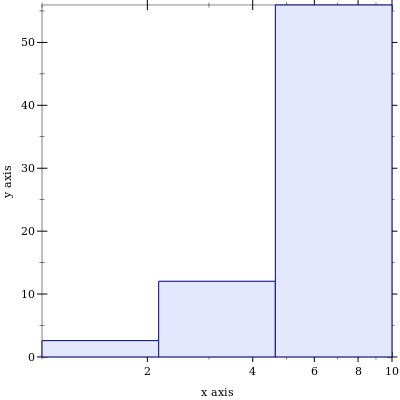
Functions that return rectangle renderers, such as rectangles and discrete-histogram3d, accept vectors of ivls as arguments. The ivl struct type is also provided by plot so users of such renderers do not have to require plot/utils.
procedure
(rational-ivl? i) → boolean?
i : any/c
Example: | ||
|
procedure
(bounds->intervals xs) → (listof ivl?)
xs : (listof real?)
Example: | ||
|
procedure
(clamp-real x i) → real?
x : real? i : ivl?
7.5 Dates and Times
procedure
(datetime->real x) → real?
x : (or/c plot-time? date? date*? sql-date? sql-time? sql-timestamp?)
For dates, the value returned is the number of seconds since a system-dependent UTC epoch. See date-ticks for more information.
To plot a time series using dates pulled from an SQL database, simply set the relevant axis ticks (probably plot-x-ticks) to date-ticks, and convert the dates to seconds using datetime->real before passing them to lines. To keep time zone offsets from influencing the plot, set them to 0 first.
struct
(struct plot-time (second minute hour day) #:extra-constructor-name make-plot-time) second : (and/c (>=/c 0) (</c 60)) minute : (integer-in 0 59) hour : (integer-in 0 23) day : exact-integer?
Plot (specifically time-ticks) uses plot-time internally to format times, but because renderer-producing functions require only real values, user code should not need it. It is provided just in case.
procedure
(plot-time->seconds t) → real?
t : plot-time?
procedure
(seconds->plot-time s) → plot-time?
s : real?
Examples: | ||||||||||
|