6.12
6 Axis Transforms and Ticks
6.1 Axis Transforms
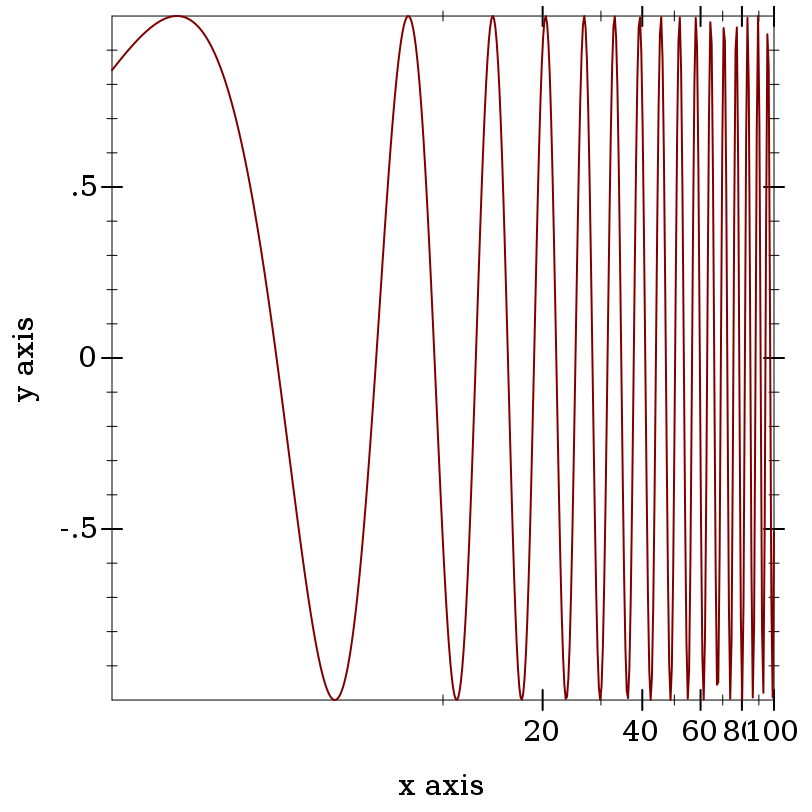
Most
log-transformed plots use different ticks than the default, uniformly spaced ticks, however.
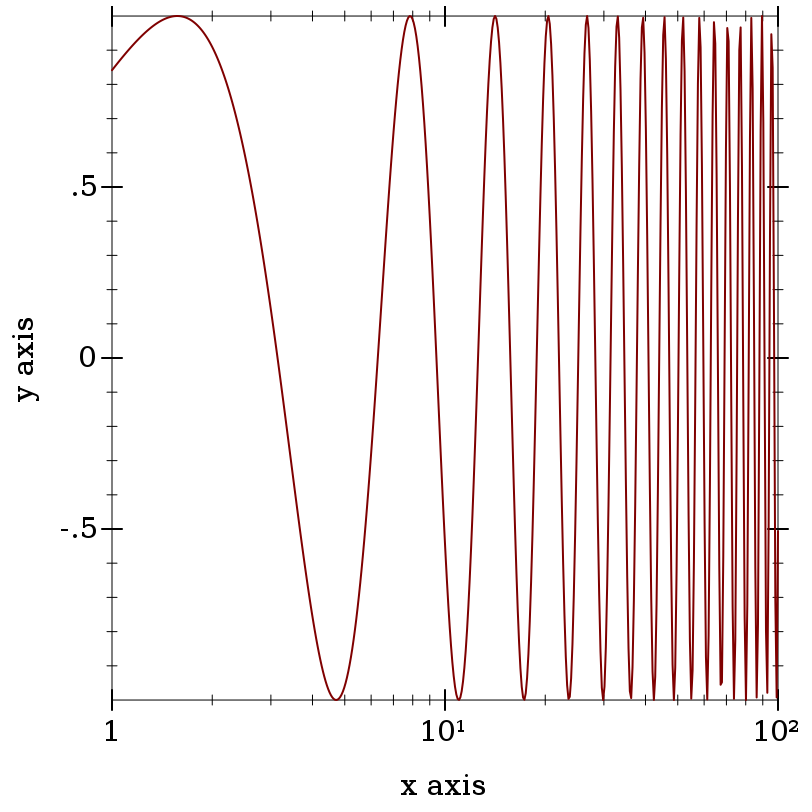
To put log ticks on the
x axis, set the
plot-x-ticks parameter:
See
Axis Ticks for more details on parameterizing a plot’s axis ticks.
To sample nonlinearly, the inverse of a transform is applied to linearly sampled points. See make-axis-transform and nonlinear-seq.
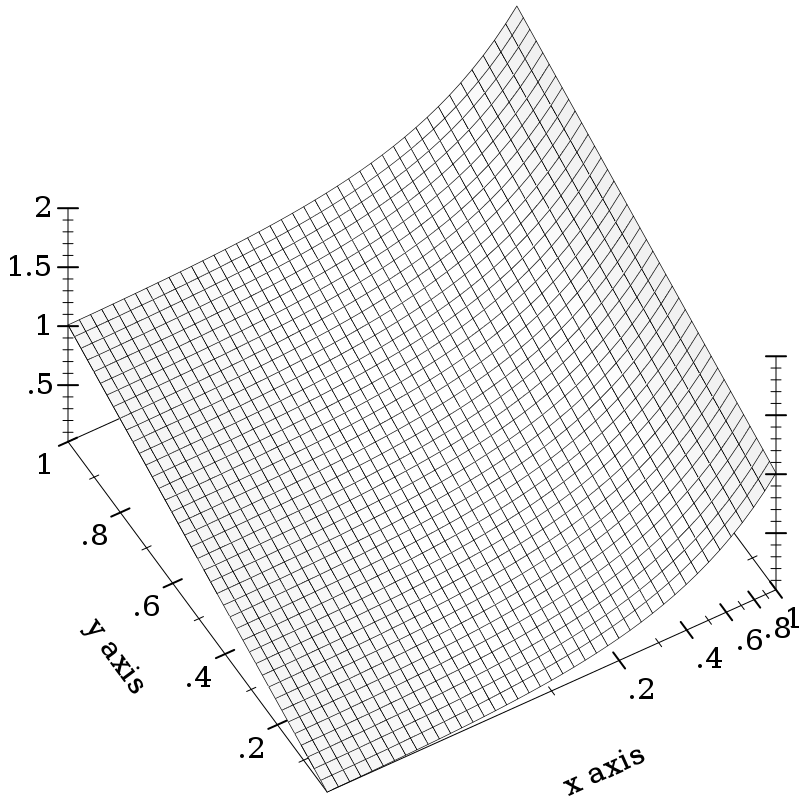
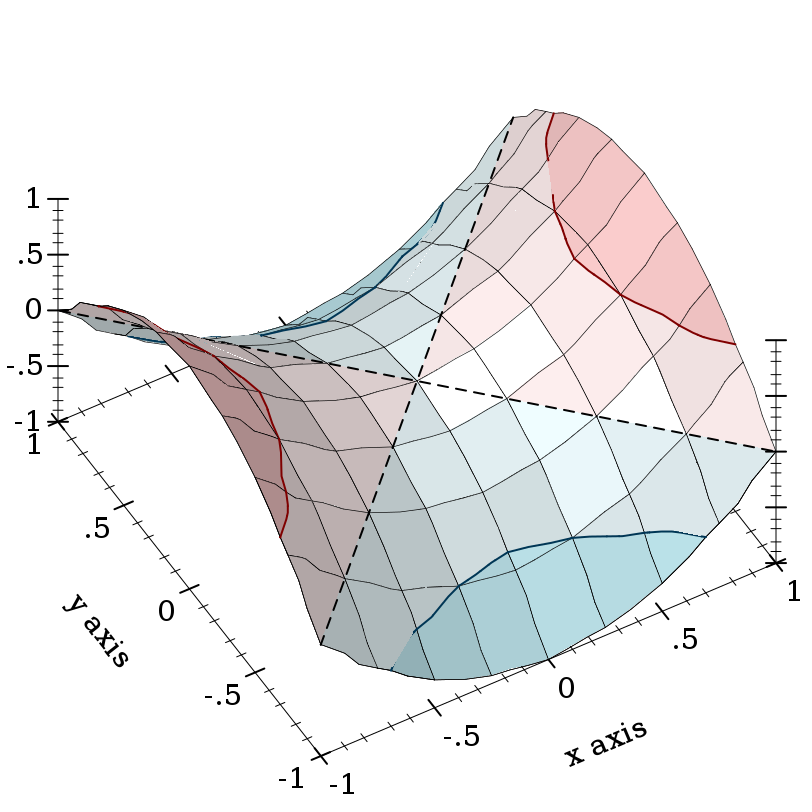
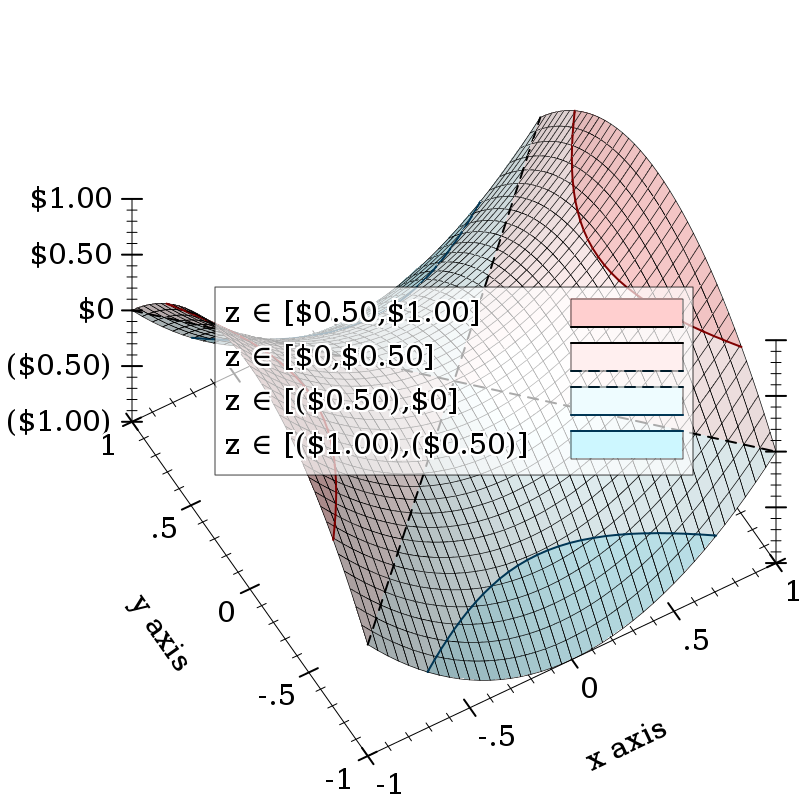
Renderers cooperate with the current transforms by sampling nonlinearly. For example,
Notice that the surface is sampled uniformly in appearance even though the x-axis ticks are not spaced uniformly.
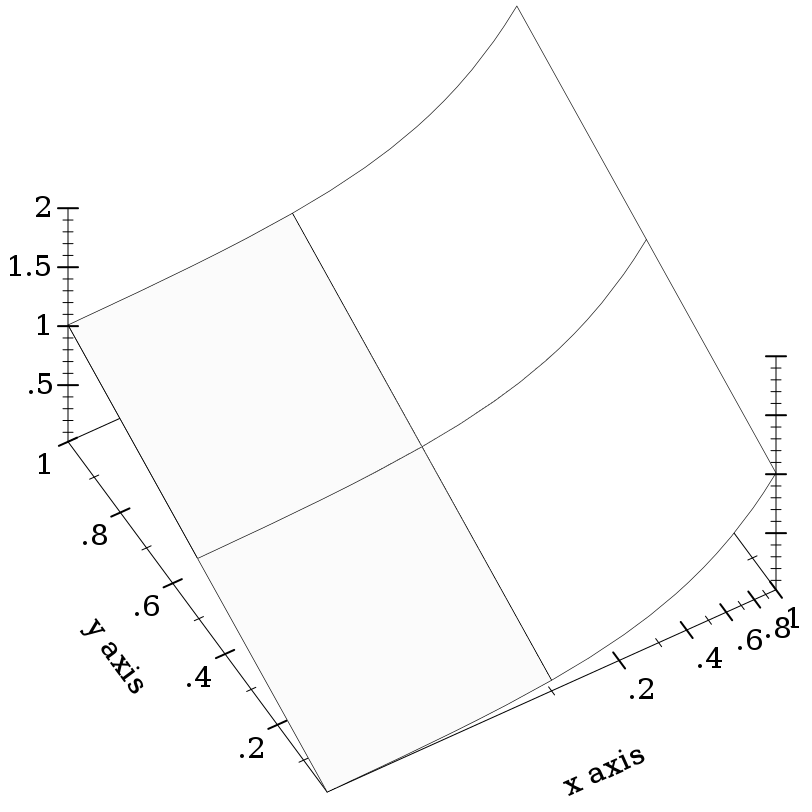
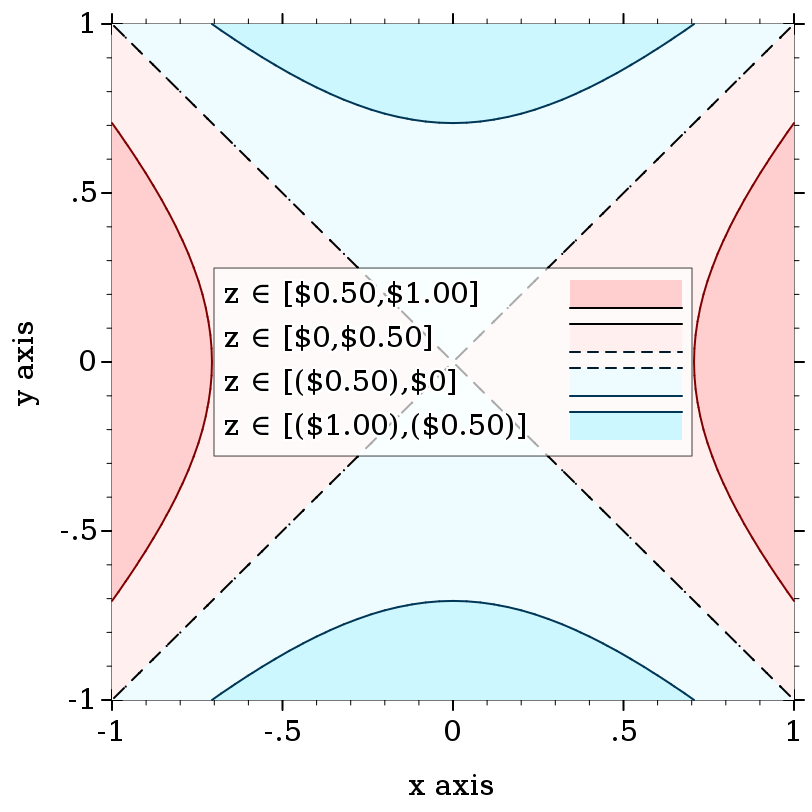
Transforms are applied to the primitive shapes that comprise a plot:
Here, the renderer returned by
surface3d does not have to bend the polygons it draws;
plot3d does this automatically (by recursive subdivision).
Independent, per-axis, monotone, nonlinear transforms. Plot comes with some typical (and some atypical) axis transforms, documented immediately below.
The identity axis transform, the default transform for all axes.
A log transform. Use this to generate plots with log-scale axes. Any such axis must have positive bounds.
|
log-transform: expects type <positive real> as 1st argument, given: -1; other arguments were: 1 |
|
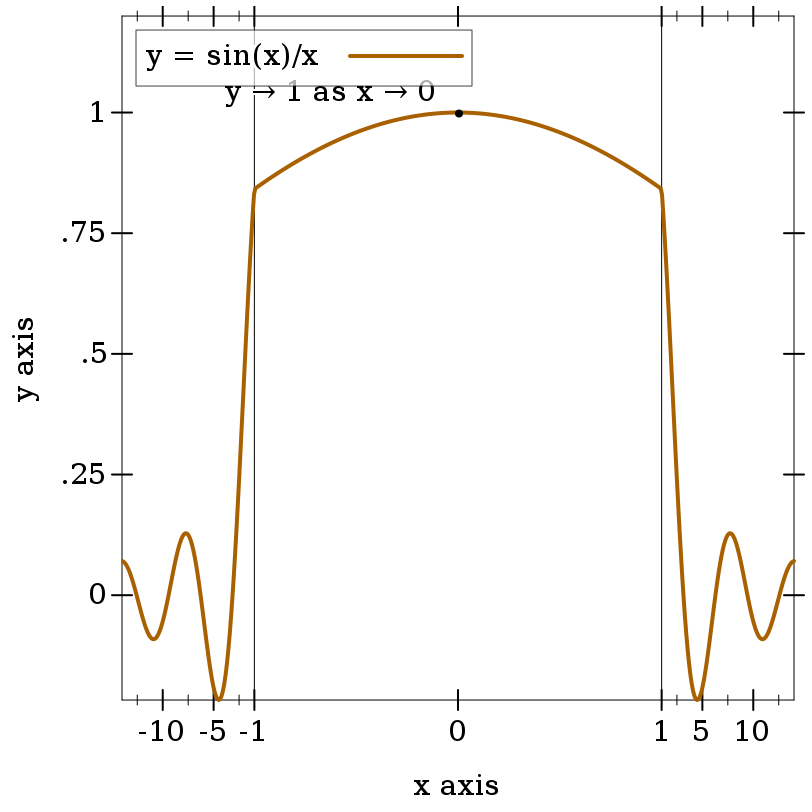
Returns an axis transform that stretches a finite interval.
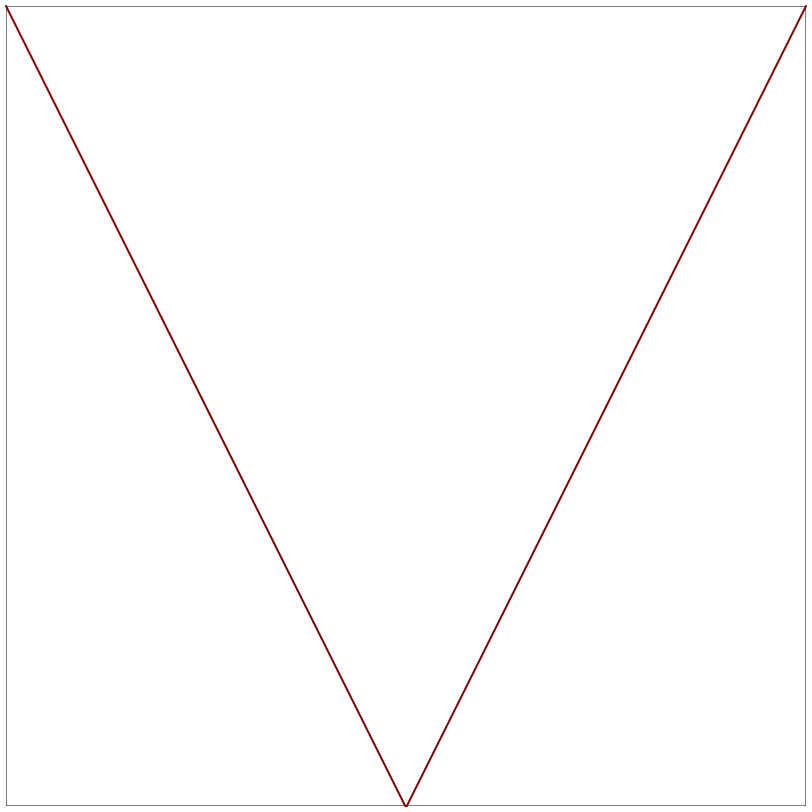
The following example uses a
stretch-transform to draw attention to the interval [-1,1] in an illustration of the limit of
sin(x)/x as
x approaches zero (a critical part of proving the derivative of
sin(x)):
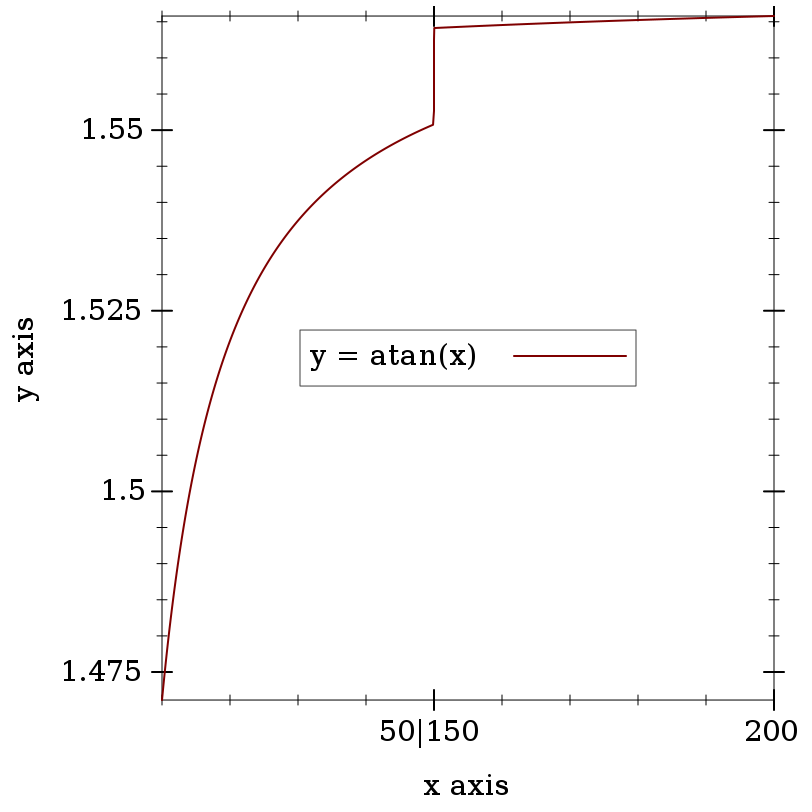
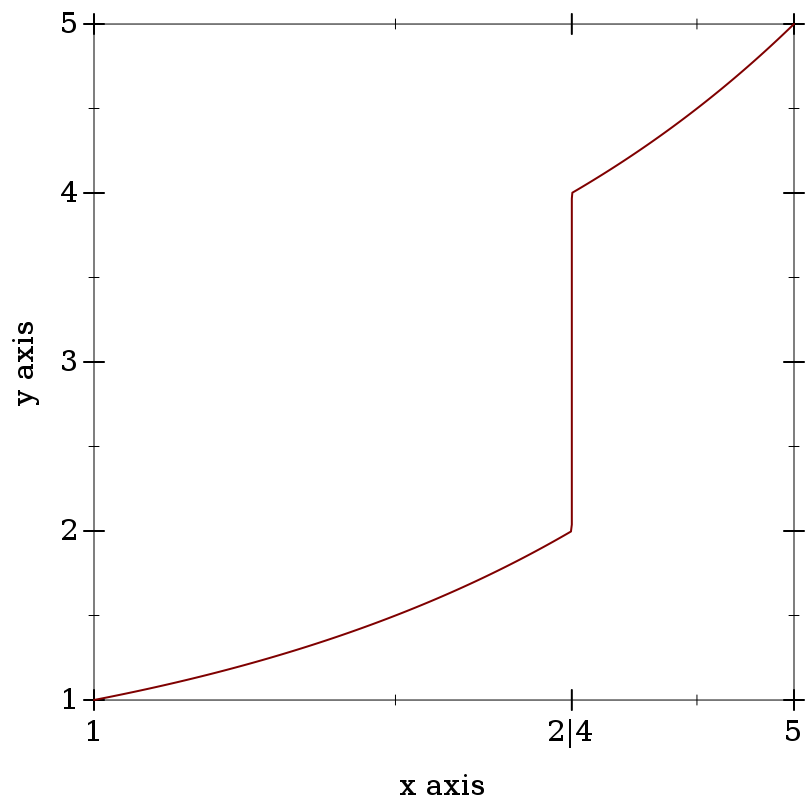
Returns an axis transform that collapses a finite interval to its midpoint.
For example, to remove part of the long, boring asymptotic approach of atan(x) toward π/2:
In this case, there were already ticks at the collapsed interval’s endpoints.
If there had not been, it would have been necessary to use
ticks-add to let viewers know precisely the interval that was collapsed.
(See
stretch-transform for an example.)
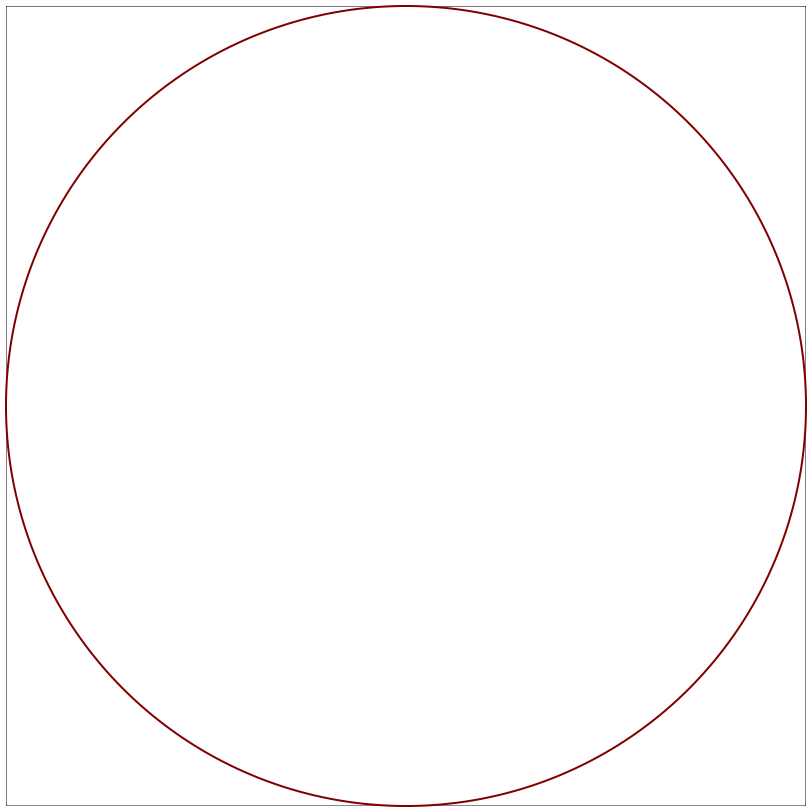
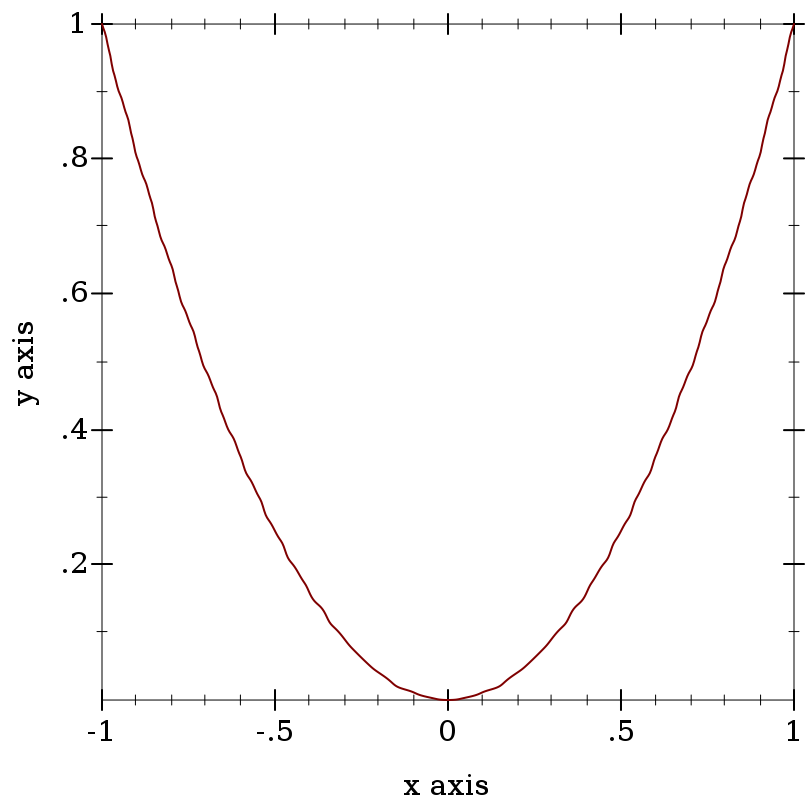
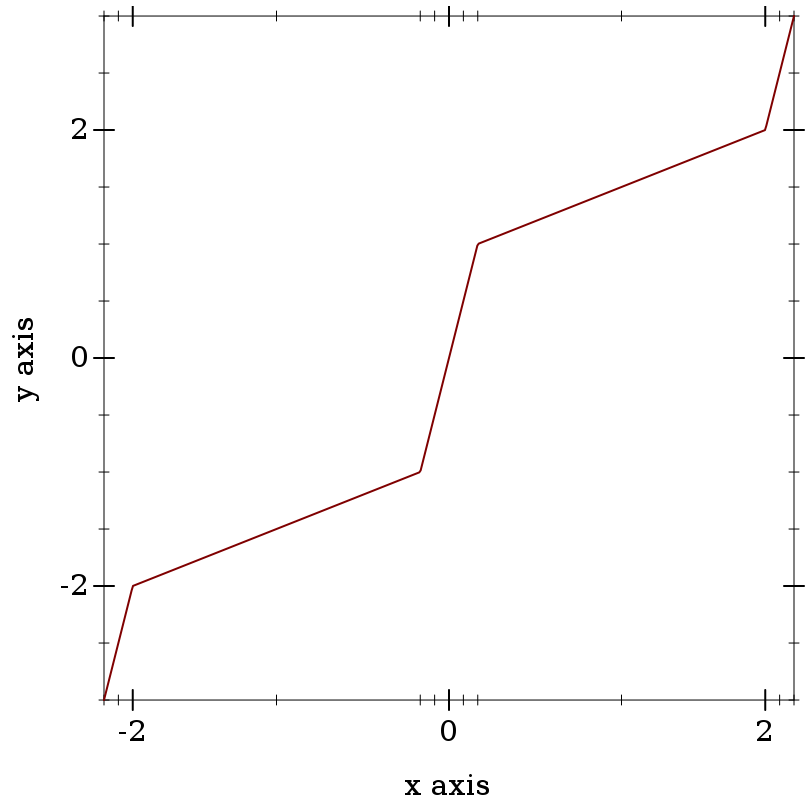
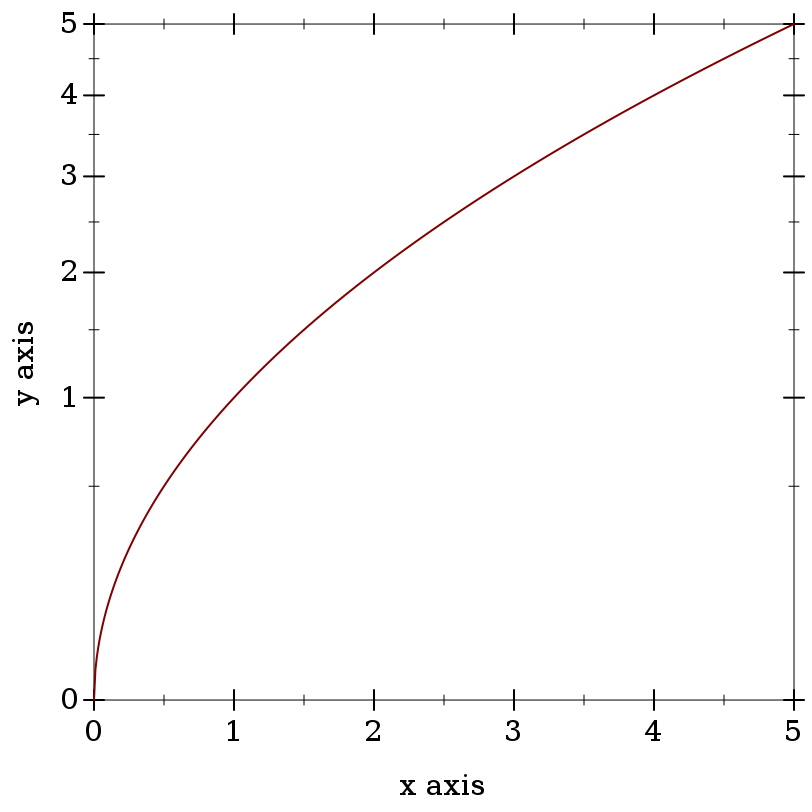
A “cube-root” transform, mostly used for testing.
Unlike the log transform, it is defined on the entire real line, making it better for testing the appearance of plots with nonlinearly transformed axes.
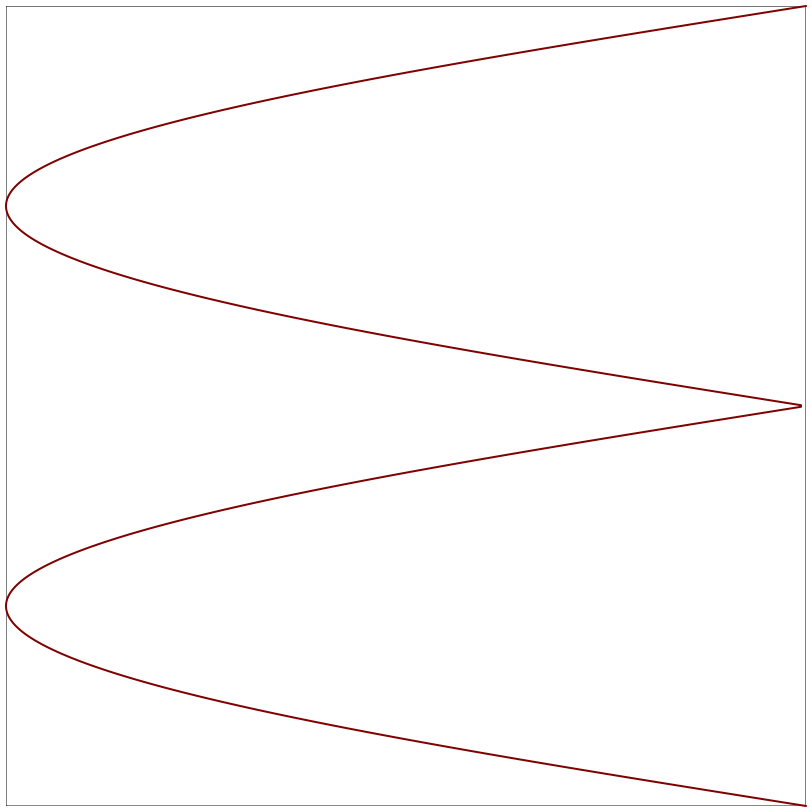
An extremely important test case, which makes sure that Plot can use any monotone, invertible function as an axis transform.
The freq parameter controls the “shakiness” of the transform. At high values, it makes plots look like Peanuts cartoons.
The contract for axis transforms.
The easiest ways to construct novel axis transforms are to use the axis transform combinators axis-transform-append, axis-transform-bound and axis-transform-compose, or to apply make-axis-transform to an invertible-function.
Returns an axis transform that transforms values less than mid like t1, and transforms values greater than mid like t2.
(Whether it transforms mid like t1 or t2 is immaterial, as a transformed mid is equal to mid either way.)
Returns an axis transform that transforms values like
t does in the interval [
a,
b], but like the identity transform outside of it.
For example, to bound
log-transform to an interval in which it is well-defined,
Composes two axis transforms.
For example, to collapse part of a
log-transformed axis, try something like
Argument order matters, but predicting the effects of exchanging arguments can be difficult.
Fortunately, the effects are usually slight.
Given a monotone
invertible-function, returns an axis transform.
Monotonicity is necessary, but cannot be enforced.
The inverse is used to take samples uniformly along transformed axes (see
nonlinear-seq).
Example:
An axis transform created by
make-axis-transform (or by any of the above combinators) does not transform the endpoints of an axis’s bounds, to within floating-point error.
For example,
|
'(1.0 2.2618595071429146 3.0) | '(1.0 1.9999999999999998 3.0000000000000004) |
|
Technically, fun does not need to be truly invertible.
Given fun = (invertible-function f g), it is enough for f to be a left inverse of g;
that is, always (f (g x)) = x but not necessarily (g (f x)) = x.
If f and g had to be strict inverses of each other, there could be no collapse-transform.
Returns an invertible function that transforms axis points within the given axis bounds.
This convenience function is used internally to transform points before rendering, but is provided for completeness.
6.2 Axis Ticks
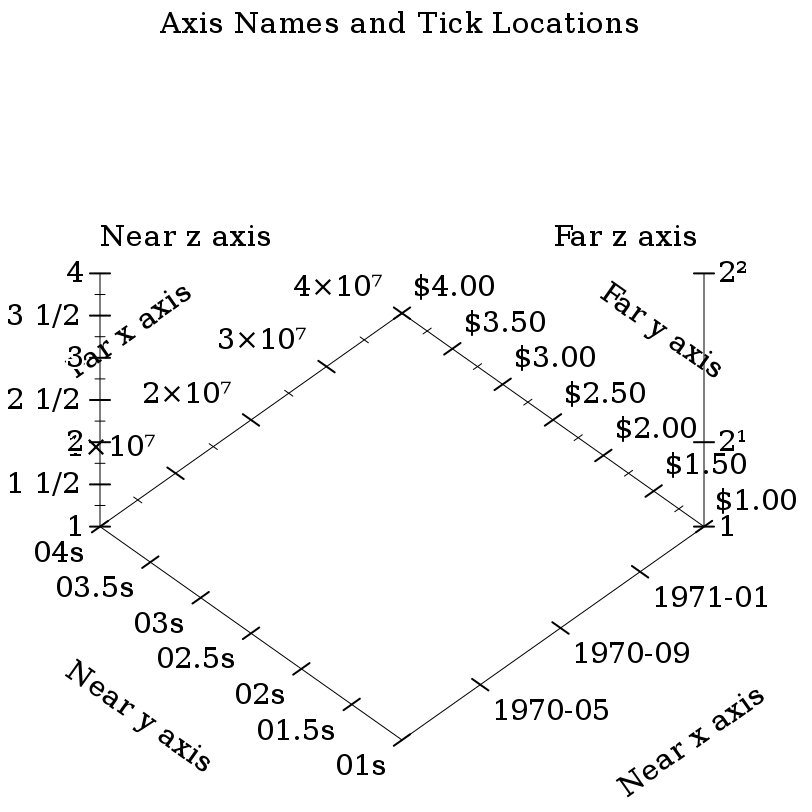
Each plot axis has two indepedent sets of ticks: the near ticks and the far ticks.
At any #:angle, the far x and y ticks are behind the plot, and the far z ticks are on the right.
Far ticks are drawn, but not labeled, if they are identical to their corresponding near ticks.
They are always identical by default.
Major ticks are longer than minor ticks. Major tick labels are always drawn unless collapsed with a nearby tick.
Minor tick labels are never drawn.
When levels is 'auto, the returned values do not correspond exactly with the values of ticks returned by z-ticks: they might be missing the endpoint values. For example,
|
'(0 1/5 2/5 3/5 4/5 1) |
|
'(1/5 2/5 3/5 4/5) |
A
ticks for a near or far axis consists of a
layout function, which determines the number of ticks and where they will be placed, and a
format function, which determines the ticks’ labels.
Generates the
tick values for the range [
min,
max], with layout and format specified by
ticks.
Example:
| > (ticks-generate (plot-x-ticks) 1/3 2/3) |
(list | (tick 7/20 #f ".35") | (tick 2/5 #t ".4") | (tick 9/20 #f ".45") | (tick 1/2 #t ".5") | (tick 11/20 #f ".55") | (tick 3/5 #t ".6") | (tick 13/20 #f ".65")) |
|
Most tick layout functions (and thus their corresponding
ticks-constructing functions) have a
#:number keyword argument with default
(ticks-default-number).
What the number means depends on the tick layout function.
Most use it for an average number of major ticks.
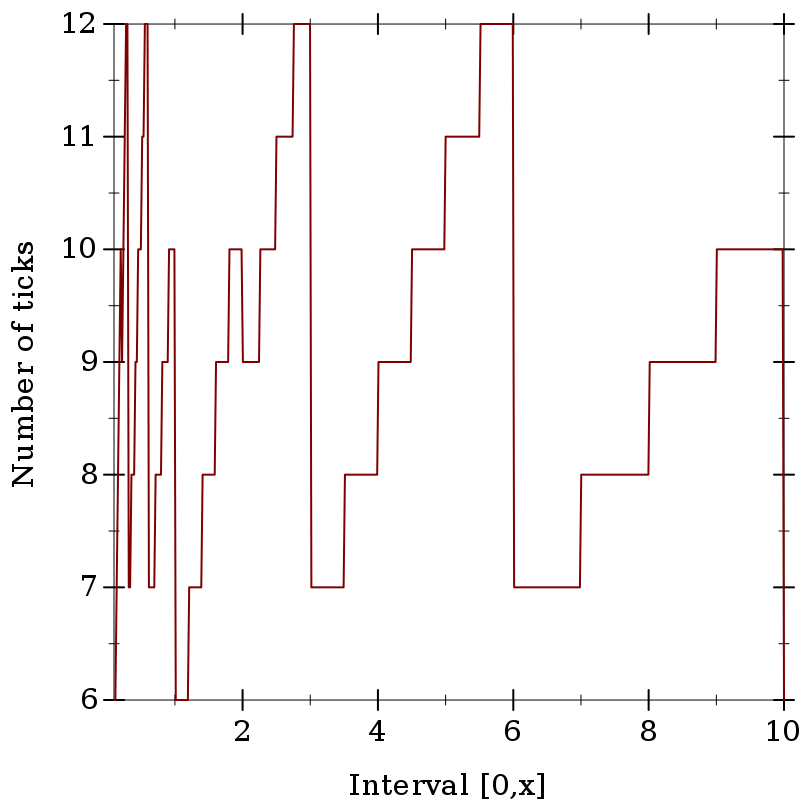
It is unlikely to mean the exact number of major ticks.
Without adjusting the number of ticks, layout functions usually cannot find uniformly spaced ticks that will have simple labels after formatting.
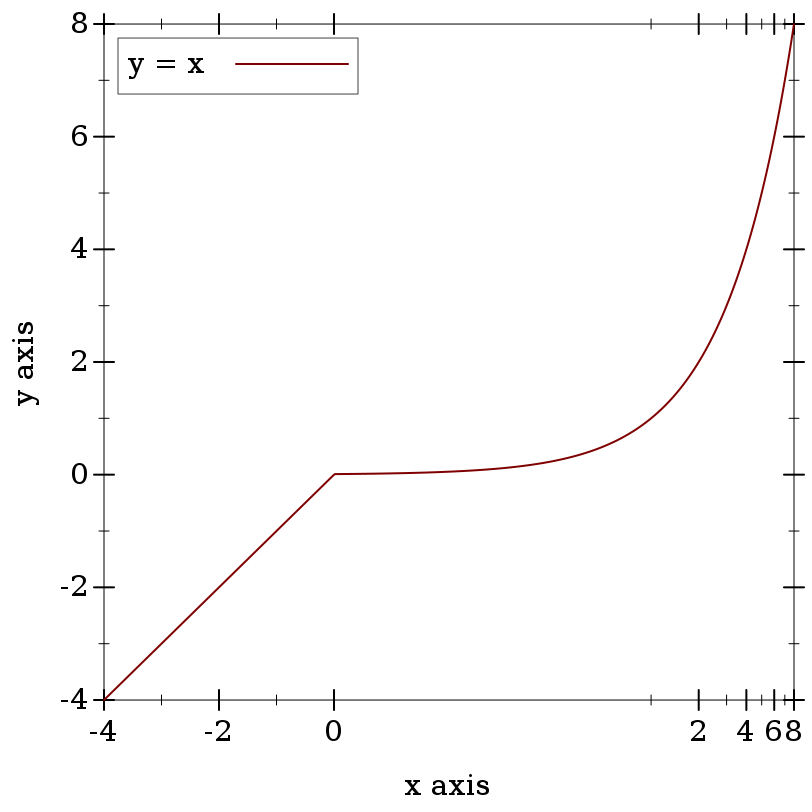
For example, the following plot shows the actual number of major ticks for the interval [0,
x] when the requested number of ticks is 8, as generated by
linear-ticks-layout:
6.2.1 Linear Ticks
The layout function, format function, and combined
ticks for uniformly spaced ticks.
To lay out ticks, linear-ticks-layout finds the power of base closest to the axis interval size, chooses a simple first tick, and then chooses a skip length using divisors that maximizes the number of ticks without exceeding number.
For strategic use of non-default arguments, see bit/byte-ticks, currency-ticks, and fraction-ticks.
The default arguments correspond to the standard 1-2-5-in-base-10 rule used almost everywhere in plot tick layout.
To format ticks, linear-ticks-format uses real->plot-label, and uses digits-for-range to determine the maximum number of fractional digits in the decimal expansion.
6.2.2 Log Ticks
The layout function, format function, and combined
ticks for exponentially spaced major ticks.
(The minor ticks between are uniformly spaced.)
Use these ticks for
log-transformed axes, because when exponentially spaced tick positions are
log-transformed, they become uniformly spaced.
The #:base keyword argument is the logarithm base.
See plot-z-far-ticks for an example of use.
6.2.3 Date Ticks
The layout function, format function, and combined
ticks for uniformly spaced ticks with date labels.
These axis ticks regard values as being in seconds since a system-dependent Universal Coordinated Time (UTC) epoch.
(For example, the Unix and Mac OS X epoch is January 1, 1970 UTC, and the Windows epoch is January 1, 1601 UTC.)
Use date->seconds to convert local dates to seconds, or datetime->real to convert dates to UTC seconds in a way that accounts for time zone offsets.
Actually, date-ticks-layout does not always space ticks quite uniformly.
For example, it rounds ticks that are spaced about one month apart or more to the nearest month.
Generally, date-ticks-layout tries to place ticks at minute, hour, day, week, month and year boundaries, as well as common multiples such as 90 days or 6 months.
To try to avoid displaying overlapping labels, date-ticks-format chooses date formats from formats for which labels will contain no redundant information.
All the format specifiers given in srfi/19 (which are derived from Unix’s date command), except those that represent time zones, are allowed in date format strings.
The default date formats.
24h-descending-date-ticks-formats : (listof string?)
| | = | | '("~Y-~m-~d ~H:~M:~f" | | "~Y-~m-~d ~H:~M" | | "~Y-~m-~d ~Hh" | | "~Y-~m-~d" | | "~Y-~m" | | "~Y" | | "~m-~d ~H:~M:~f" | | "~m-~d ~H:~M" | | "~m-~d ~Hh" | | "~m-~d" | | "~H:~M:~f" | | "~H:~M" | | "~Hh" | | "~M:~fs" | | "~Mm" | | "~fs") |
|
|
|
12h-descending-date-ticks-formats : (listof string?)
| | = | | '("~Y-~m-~d ~I:~M:~f ~p" | | "~Y-~m-~d ~I:~M ~p" | | "~Y-~m-~d ~I ~p" | | "~Y-~m-~d" | | "~Y-~m" | | "~Y" | | "~m-~d ~I:~M:~f ~p" | | "~m-~d ~I:~M ~p" | | "~m-~d ~I ~p" | | "~m-~d" | | "~I:~M:~f ~p" | | "~I:~M ~p" | | "~I ~p" | | "~M:~fs" | | "~Mm" | | "~fs") |
|
|
|
6.2.4 Time Ticks
The layout function, format function, and combined
ticks for uniformly spaced ticks with time labels.
These axis ticks regard values as being in seconds.
Use datetime->real to convert sql-time or plot-time values to seconds.
Generally, time-ticks-layout tries to place ticks at minute, hour and day boundaries, as well as common multiples such as 12 hours or 30 days.
To try to avoid displaying overlapping labels, time-ticks-format chooses a date format from formats for which labels will contain no redundant information.
All the time-related format specifiers given in srfi/19 (which are derived from Unix’s date command) are allowed in time format strings.
The default time formats.
6.2.5 Currency Ticks
The #:kind keyword argument is either a string containing the currency symbol, or a currency code such as 'USD, 'GBP or 'EUR.
The currency-ticks-format function can map most ISO 4217 currency codes to their corresponding currency symbol.
The #:scales keyword argument is a list of suffixes for each 103 scale, such as "K" (US thousand, or kilo), "bn" (UK short-scale billion) or "Md" (EU long-scale milliard). Off-scale amounts are given power-of-ten suffixes such as “×1021.”
The #:formats keyword argument is a list of three format strings, representing the formats of positive, negative, and zero amounts, respectively. The format specifiers are:
"~$": replaced by the currency symbol
"~w": replaced by the whole part of the amount
"~f": replaced by the fractional part, with 2 or more decimal digits
"~s": replaced by the scale suffix
"~~": replaced by “~”
The default currency scales and formats.
For example, a Plot user in France would probably begin programs with
Cultural sensitivity notwithstanding, when writing for a local audience, it is generally considered proper to use local currency scales and formats for foreign currencies, but use the foreign currency symbol.
Short-scale suffix abbreviations as commonly used in the United States, Canada, and some other English-speaking countries. These stand for “kilo,” “million,” “billion,” and “trillion.”
Short-scale suffix abbreviations as commonly used in the United Kingdom since switching to the short scale in 1974, and as currently recommended by the Daily Telegraph and Times style guides.
European Union long-scale suffix abbreviations, which stand for “kilo,” “million,” “milliard,” and “billion.”
The abbreviations actually used vary with geography, even within countries, but these seem to be common.
Further long-scale suffix abbreviations such as for “billiard” are ommitted due to lack of even weak consensus.
Common currency formats used in the United States.
Common currency formats used in the United Kingdom.
Note that it sensibly uses a negative sign to denote negative amounts.
A guess at common currency formats for the European Union.
Like scale suffixes, actual formats vary with geography, but currency formats can even vary with audience or tone.
6.2.6 Other Ticks
The layout function, format function, and combined
ticks for no ticks whatsoever.
| | size : (or/c 'byte 'bit) = 'byte | | kind : (or/c 'CS 'SI) = 'CS |
|
|
The format function and and combined
ticks for bit or byte values.
The #:kind keyword argument indicates either International System of Units ('SI) suffixes, as used to communicate hard drive capacities, or Computer Science ('CS) suffixes, as used to communicate memory capacities.
If kind is 'SI, base 10 and divisors '(1 2 4 5).
If kind is 'CS, base 2 and divisors '(1 2).
6.2.7 Tick Combinators
Returns a new
ticks that acts like
t, except that it puts additional ticks at positions
xs. If
major? is true, the ticks at positions
xs are all
major ticks; otherwise, they are minor ticks.
Returns a new
ticks that acts like
t, but for an axis transformed by
fun.
Unlike with typical
Axis Transforms,
fun is allowed to transform axis endpoints.
(See
make-axis-transform for an explanation about transforming endpoints.)
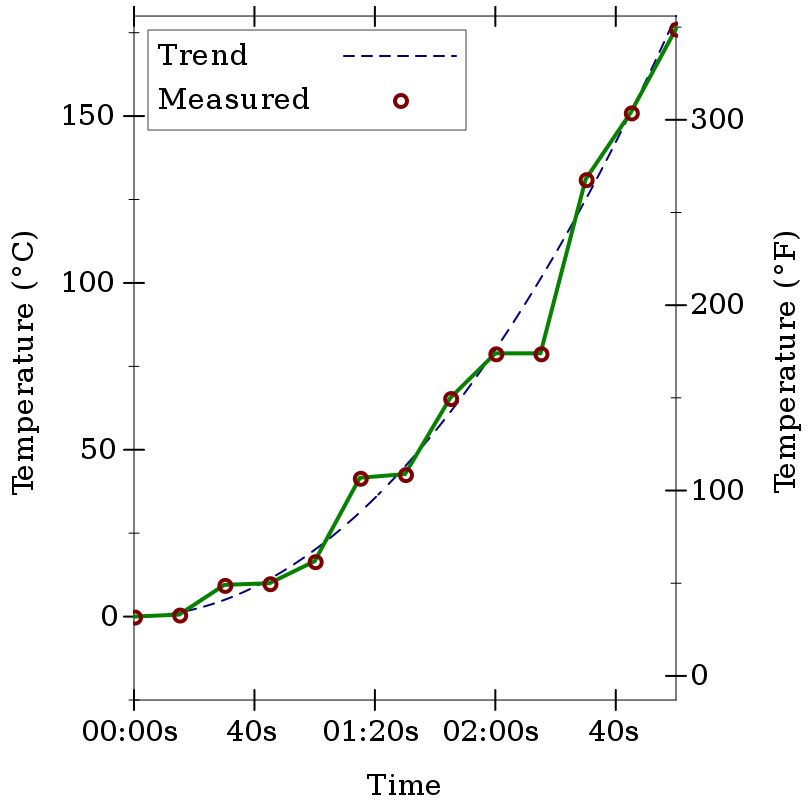
Use
ticks-scale to plot values at multiple scales simultaneously, with one scale on the near axis and one scale on the far axis.
The following example plots degrees Celsius on the left and degrees Farenheit on the right:
6.2.8 Tick Data Types and Contracts
|
| #:extra-constructor-name make-pre-tick) |
| value : real? |
| major? : boolean? |
Represents a tick that has not yet been labeled.
|
| #:extra-constructor-name make-tick) |
| label : string? |
Represents a tick with a label.
The contract for tick layout functions. Note that a layout function returns
pre-ticks, or unlabeled ticks.
The contract for tick format functions. A format function receives axis bounds so it can determine how many decimal digits to display (usually by applying
digits-for-range to the bounds).
6.3 Invertible Functions
The function itself is f, and its inverse is g.
Because real?s can be inexact, this invariant must be approximate and therefore cannot be enforced.
(For example, (exp (log 10)) = 10.000000000000002.)
The obligation to maintain it rests on whomever constructs one.
Returns the composition of two invertible functions.
Returns the inverse of an invertible function.
)