3 2D Renderers
3.1 2D Renderer Function Arguments
Required (and possibly optional) arguments representing the graph to plot.
Optional keyword arguments for overriding calculated bounds, with the default value #f.
Optional keyword arguments that determine the appearance of the plot.
The optional keyword argument #:label, which specifies the name of the renderer in the legend.
We will take function, perhaps the most commonly used renderer-producing function, as an example.
Graph arguments. The first argument to function is the required f, the function to plot. It is followed by two optional arguments x-min and x-max, which specify the renderer’s x bounds. (If not given, the x bounds will be the plot area x bounds, as requested by another renderer or specified to plot using #:x-min and #:x-max.)
These three arguments define the graph of the function f, a possibly infinite set of pairs of points x,(f x). An infinite graph cannot be plotted directly, so the renderer must approximately plot the points in it. The renderer returned by function does this by drawing lines connected end-to-end.
Overriding bounds arguments. Next in function’s argument list are the keyword arguments #:y-min and #:y-max, which override the renderer’s calculated y bounds if given.
Appearance arguments. The next keyword argument is #:samples, which determines the quality of the renderer’s approximate plot (higher is better). Following #:samples are #:color, #:width, #:style and #:alpha, which determine the color, width, style and opacity of the lines comprising the plot.
In general, the keyword arguments that determine the appearance of plots follow consistent naming conventions. The most common keywords are #:color (for fill and line colors), #:width (for line widths), #:style (for fill and line styles) and #:alpha. When a function needs both a fill color and a line color, the fill color is given using #:color, and the line color is given using #:line-color (or some variation, such as #:line1-color). Styles follow the same rule.
Every appearance keyword argument defaults to the value of a parameter. This allows whole families of plots to be altered with little work. For example, setting (line-color 3) causes every subsequent renderer that draws connected lines to draw its lines in blue.
Label argument. Lastly, there is #:label. If given, the function renderer will generate a label entry that plot puts in the legend.
Not every renderer-producing function has a #:label argument; for example, error-bars.
3.2 2D Point Renderers
(points vs [ #:x-min x-min #:x-max x-max #:y-min y-min #:y-max y-max #:sym sym #:color color #:fill-color fill-color #:size size #:line-width line-width #:alpha alpha #:label label]) → renderer2d? vs : (listof (vector/c real? real?)) x-min : (or/c rational? #f) = #f x-max : (or/c rational? #f) = #f y-min : (or/c rational? #f) = #f y-max : (or/c rational? #f) = #f sym : point-sym/c = (point-sym) color : plot-color/c = (point-color) fill-color : (or/c plot-color/c 'auto) = 'auto size : (>=/c 0) = (point-size) line-width : (>=/c 0) = (point-line-width) alpha : (real-in 0 1) = (point-alpha) label : (or/c string? #f) = #f
> (parameterize ([plot-width 150] [plot-height 150] [plot-x-label #f] [plot-y-label #f]) (define xs (build-list 20 (λ _ (random)))) (define ys (build-list 20 (λ _ (random)))) (list (plot (points (map vector xs ys))) (plot (points (map vector xs ys) #:x-min 0 #:x-max 1 #:y-min 0 #:y-max 1)))) (list
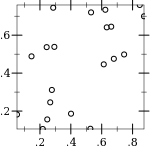
)
The #:sym argument may be any integer, a Unicode character or string, or a symbol in known-point-symbols. Use an integer when you need different points but don’t care exactly what they are.
(vector-field f [ x-min x-max y-min y-max #:samples samples #:scale scale #:color color #:line-width line-width #:line-style line-style #:alpha alpha #:label label]) → renderer2d?
f :
(or/c (real? real? . -> . (vector/c real? real?)) ((vector/c real? real?) . -> . (vector/c real? real?))) x-min : (or/c rational? #f) = #f x-max : (or/c rational? #f) = #f y-min : (or/c rational? #f) = #f y-max : (or/c rational? #f) = #f samples : exact-positive-integer? = (vector-field-samples)
scale : (or/c real? (one-of/c 'auto 'normalized)) = (vector-field-scale) color : plot-color/c = (vector-field-color) line-width : (>=/c 0) = (vector-field-line-width) line-style : plot-pen-style/c = (vector-field-line-style) alpha : (real-in 0 1) = (vector-field-alpha) label : (or/c string? #f) = #f
If scale is a real number, arrow lengths are multiplied by scale. If 'auto, the scale is calculated in a way that keeps arrows from overlapping. If 'normalized, each arrow is made the same length: the maximum length that would have been allowed by 'auto.
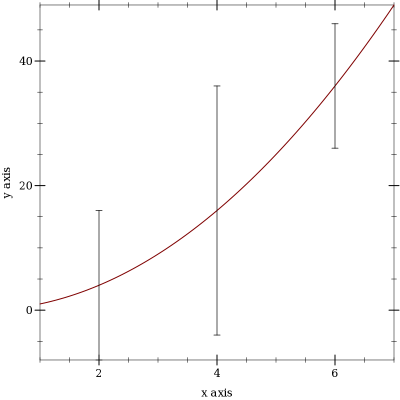
(error-bars bars [ #:x-min x-min #:x-max x-max #:y-min y-min #:y-max y-max #:color color #:line-width line-width #:line-style line-style #:width width #:alpha alpha]) → renderer2d? bars : (listof (vector/c real? real? real?)) x-min : (or/c rational? #f) = #f x-max : (or/c rational? #f) = #f y-min : (or/c rational? #f) = #f y-max : (or/c rational? #f) = #f color : plot-color/c = (error-bar-color) line-width : (>=/c 0) = (error-bar-line-width) line-style : plot-pen-style/c = (error-bar-line-style) width : (>=/c 0) = (error-bar-width) alpha : (real-in 0 1) = (error-bar-alpha)
> (plot (list (function sqr 1 7) (error-bars (list (vector 2 4 12) (vector 4 16 20) (vector 6 36 10)))))
3.3 2D Line Renderers
(function f [ x-min x-max #:y-min y-min #:y-max y-max #:samples samples #:color color #:width width #:style style #:alpha alpha #:label label]) → renderer2d? f : (real? . -> . real?) x-min : (or/c rational? #f) = #f x-max : (or/c rational? #f) = #f y-min : (or/c rational? #f) = #f y-max : (or/c rational? #f) = #f samples : (and/c exact-integer? (>=/c 2)) = (line-samples) color : plot-color/c = (line-color) width : (>=/c 0) = (line-width) style : plot-pen-style/c = (line-style) alpha : (real-in 0 1) = (line-alpha) label : (or/c string? #f) = #f
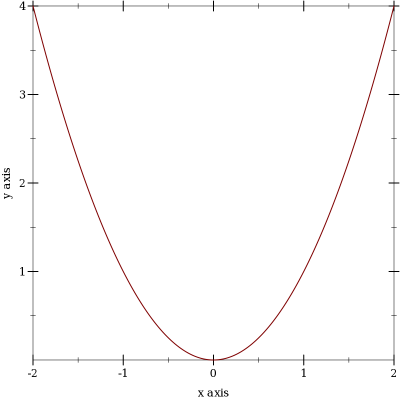
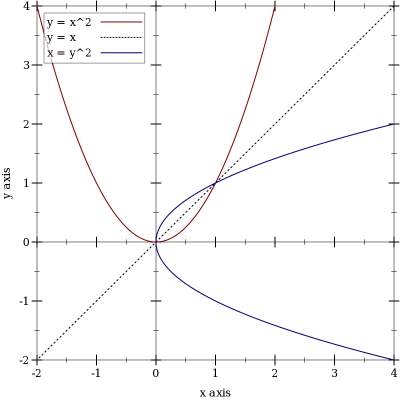
(inverse f [ y-min y-max #:x-min x-min #:x-max x-max #:samples samples #:color color #:width width #:style style #:alpha alpha #:label label]) → renderer2d? f : (real? . -> . real?) y-min : (or/c rational? #f) = #f y-max : (or/c rational? #f) = #f x-min : (or/c rational? #f) = #f x-max : (or/c rational? #f) = #f samples : (and/c exact-integer? (>=/c 2)) = (line-samples) color : plot-color/c = (line-color) width : (>=/c 0) = (line-width) style : plot-pen-style/c = (line-style) alpha : (real-in 0 1) = (line-alpha) label : (or/c string? #f) = #f
> (plot (list (axes) (function sqr -2 2 #:label "y = x^2") (function (λ (x) x) #:color 0 #:style 'dot #:label "y = x") (inverse sqr -2 2 #:color 3 #:label "x = y^2")))
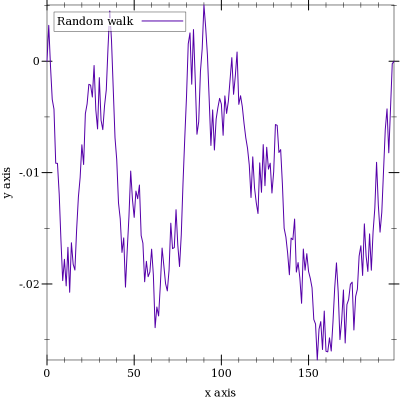
(lines vs [ #:x-min x-min #:x-max x-max #:y-min y-min #:y-max y-max #:color color #:width width #:style style #:alpha alpha #:label label]) → renderer2d? vs : (listof (vector/c real? real?)) x-min : (or/c rational? #f) = #f x-max : (or/c rational? #f) = #f y-min : (or/c rational? #f) = #f y-max : (or/c rational? #f) = #f color : plot-color/c = (line-color) width : (>=/c 0) = (line-width) style : plot-pen-style/c = (line-style) alpha : (real-in 0 1) = (line-alpha) label : (or/c string? #f) = #f
> (plot (lines (reverse (for/fold ([lst (list (vector 0 0))]) ([i (in-range 1 200)]) (match-define (vector x y) (first lst)) (cons (vector i (+ y (* 1/100 (- (random) 1/2)))) lst))) #:color 6 #:label "Random walk"))
The parametric and polar functions are defined using lines.
(parametric f t-min t-max [ #:x-min x-min #:x-max x-max #:y-min y-min #:y-max y-max #:samples samples #:color color #:width width #:style style #:alpha alpha #:label label]) → renderer2d? f : (real? . -> . (vector/c real? real?)) t-min : rational? t-max : rational? x-min : (or/c rational? #f) = #f x-max : (or/c rational? #f) = #f y-min : (or/c rational? #f) = #f y-max : (or/c rational? #f) = #f samples : (and/c exact-integer? (>=/c 2)) = (line-samples) color : plot-color/c = (line-color) width : (>=/c 0) = (line-width) style : plot-pen-style/c = (line-style) alpha : (real-in 0 1) = (line-alpha) label : (or/c string? #f) = #f
(polar f [ θ-min θ-max #:x-min x-min #:x-max x-max #:y-min y-min #:y-max y-max #:samples samples #:color color #:width width #:style style #:alpha alpha #:label label]) → renderer2d? f : (real? . -> . real?) θ-min : real? = 0 θ-max : real? = (* 2 pi) x-min : (or/c rational? #f) = #f x-max : (or/c rational? #f) = #f y-min : (or/c rational? #f) = #f y-max : (or/c rational? #f) = #f samples : (and/c exact-integer? (>=/c 2)) = (line-samples) color : plot-color/c = (line-color) width : (>=/c 0) = (line-width) style : plot-pen-style/c = (line-style) alpha : (real-in 0 1) = (line-alpha) label : (or/c string? #f) = #f
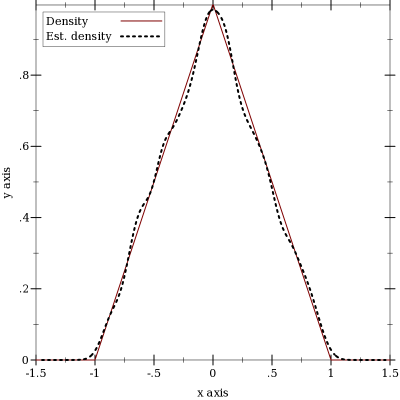
(density xs [ bw-adjust #:x-min x-min #:x-max x-max #:y-min y-min #:y-max y-max #:samples samples #:color color #:width width #:style style #:alpha alpha #:label label]) → renderer2d? xs : (listof real?) bw-adjust : real? = 1 x-min : (or/c rational? #f) = #f x-max : (or/c rational? #f) = #f y-min : (or/c rational? #f) = #f y-max : (or/c rational? #f) = #f samples : (and/c exact-integer? (>=/c 2)) = (line-samples) color : plot-color/c = (line-color) width : (>=/c 0) = (line-width) style : plot-pen-style/c = (line-style) alpha : (real-in 0 1) = (line-alpha) label : (or/c string? #f) = #f
> (plot (list (function (λ (x) (cond [(or (x . < . -1) (x . > . 1)) 0] [(x . < . 0) (+ 1 x)] [(x . >= . 0) (- 1 x)])) -1.5 1.5 #:label "Density") (density (build-list 2000 (λ (n) (- (+ (random) (random)) 1))) #:color 0 #:width 2 #:style 'dot #:label "Est. density")))
3.4 2D Interval Renderers
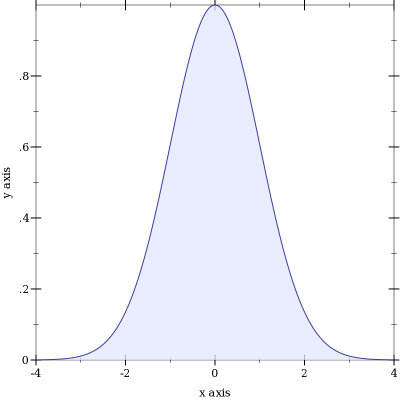
These renderers each correspond with a line renderer, and graph the area between two lines.
(function-interval f1 f2 [ x-min x-max #:y-min y-min #:y-max y-max #:samples samples #:color color #:style style #:line1-color line1-color #:line1-width line1-width #:line1-style line1-style #:line2-color line2-color #:line2-width line2-width #:line2-style line2-style #:alpha alpha #:label label]) → renderer2d? f1 : (real? . -> . real?) f2 : (real? . -> . real?) x-min : (or/c rational? #f) = #f x-max : (or/c rational? #f) = #f y-min : (or/c rational? #f) = #f y-max : (or/c rational? #f) = #f samples : (and/c exact-integer? (>=/c 2)) = (line-samples) color : plot-color/c = (interval-color) style : plot-brush-style/c = (interval-style) line1-color : plot-color/c = (interval-line1-color) line1-width : (>=/c 0) = (interval-line1-width) line1-style : plot-pen-style/c = (interval-line1-style) line2-color : plot-color/c = (interval-line2-color) line2-width : (>=/c 0) = (interval-line2-width) line2-style : plot-pen-style/c = (interval-line2-style) alpha : (real-in 0 1) = (interval-alpha) label : (or/c string? #f) = #f
> (plot (function-interval (λ (x) 0) (λ (x) (exp (* -1/2 (sqr x)))) -4 4 #:line1-style 'transparent))
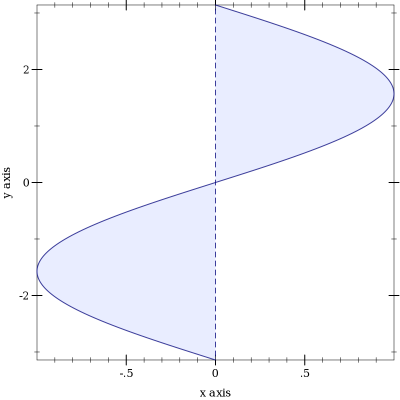
(inverse-interval f1 f2 [ y-min y-max #:x-min x-min #:x-max x-max #:samples samples #:color color #:style style #:line1-color line1-color #:line1-width line1-width #:line1-style line1-style #:line2-color line2-color #:line2-width line2-width #:line2-style line2-style #:alpha alpha #:label label]) → renderer2d? f1 : (real? . -> . real?) f2 : (real? . -> . real?) y-min : (or/c rational? #f) = #f y-max : (or/c rational? #f) = #f x-min : (or/c rational? #f) = #f x-max : (or/c rational? #f) = #f samples : (and/c exact-integer? (>=/c 2)) = (line-samples) color : plot-color/c = (interval-color) style : plot-brush-style/c = (interval-style) line1-color : plot-color/c = (interval-line1-color) line1-width : (>=/c 0) = (interval-line1-width) line1-style : plot-pen-style/c = (interval-line1-style) line2-color : plot-color/c = (interval-line2-color) line2-width : (>=/c 0) = (interval-line2-width) line2-style : plot-pen-style/c = (interval-line2-style) alpha : (real-in 0 1) = (interval-alpha) label : (or/c string? #f) = #f
> (plot (inverse-interval sin (λ (x) 0) (- pi) pi #:line2-style 'long-dash))
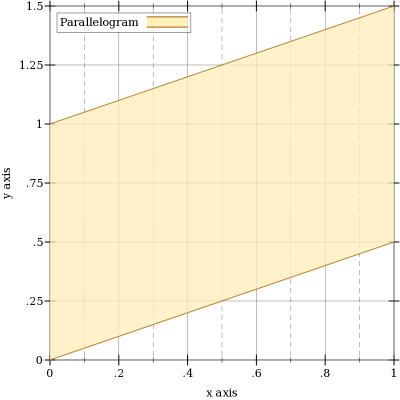
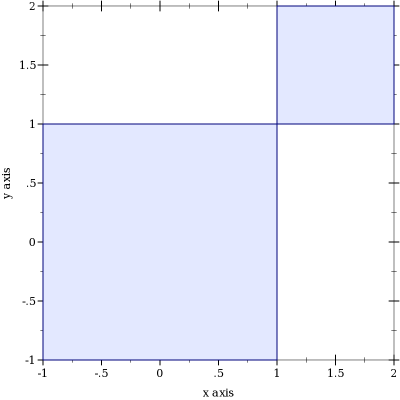
(lines-interval v1s v2s [ #:x-min x-min #:x-max x-max #:y-min y-min #:y-max y-max #:color color #:style style #:line1-color line1-color #:line1-width line1-width #:line1-style line1-style #:line2-color line2-color #:line2-width line2-width #:line2-style line2-style #:alpha alpha #:label label]) → renderer2d? v1s : (listof (vector/c real? real?)) v2s : (listof (vector/c real? real?)) x-min : (or/c rational? #f) = #f x-max : (or/c rational? #f) = #f y-min : (or/c rational? #f) = #f y-max : (or/c rational? #f) = #f color : plot-color/c = (interval-color) style : plot-brush-style/c = (interval-style) line1-color : plot-color/c = (interval-line1-color) line1-width : (>=/c 0) = (interval-line1-width) line1-style : plot-pen-style/c = (interval-line1-style) line2-color : plot-color/c = (interval-line2-color) line2-width : (>=/c 0) = (interval-line2-width) line2-style : plot-pen-style/c = (interval-line2-style) alpha : (real-in 0 1) = (interval-alpha) label : (or/c string? #f) = #f
> (plot (list (tick-grid) (lines-interval (list #(0 0) #(1 1/2)) (list #(0 1) #(1 3/2)) #:color 4 #:line1-color 4 #:line2-color 4 #:label "Parallelogram")))
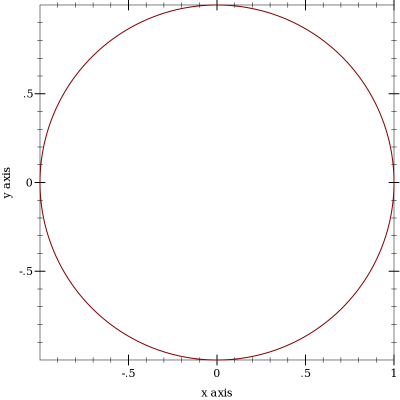
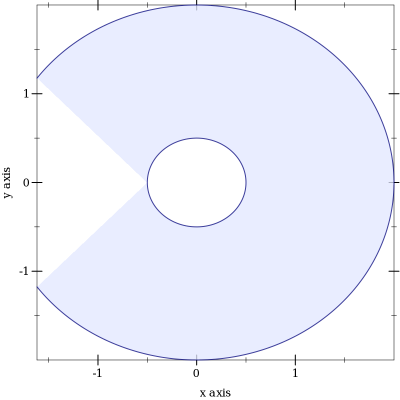
(parametric-interval f1 f2 t-min t-max [ #:x-min x-min #:x-max x-max #:y-min y-min #:y-max y-max #:samples samples #:color color #:style style #:line1-color line1-color #:line1-width line1-width #:line1-style line1-style #:line2-color line2-color #:line2-width line2-width #:line2-style line2-style #:alpha alpha #:label label]) → renderer2d? f1 : (real? . -> . (vector/c real? real?)) f2 : (real? . -> . (vector/c real? real?)) t-min : rational? t-max : rational? x-min : (or/c rational? #f) = #f x-max : (or/c rational? #f) = #f y-min : (or/c rational? #f) = #f y-max : (or/c rational? #f) = #f samples : (and/c exact-integer? (>=/c 2)) = (line-samples) color : plot-color/c = (interval-color) style : plot-brush-style/c = (interval-style) line1-color : plot-color/c = (interval-line1-color) line1-width : (>=/c 0) = (interval-line1-width) line1-style : plot-pen-style/c = (interval-line1-style) line2-color : plot-color/c = (interval-line2-color) line2-width : (>=/c 0) = (interval-line2-width) line2-style : plot-pen-style/c = (interval-line2-style) alpha : (real-in 0 1) = (interval-alpha) label : (or/c string? #f) = #f
> (define (f1 t) (vector (* 2 (cos (* 4/5 t))) (* 2 (sin (* 4/5 t)))))
> (define (f2 t) (vector (* 1/2 (cos t)) (* 1/2 (sin t))))
> (plot (parametric-interval f1 f2 (- pi) pi))
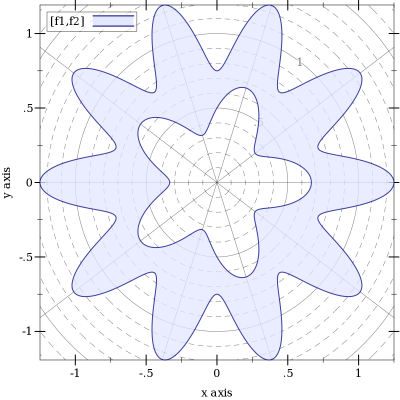
(polar-interval f1 f2 [ θ-min θ-max #:x-min x-min #:x-max x-max #:y-min y-min #:y-max y-max #:samples samples #:color color #:style style #:line1-color line1-color #:line1-width line1-width #:line1-style line1-style #:line2-color line2-color #:line2-width line2-width #:line2-style line2-style #:alpha alpha #:label label]) → renderer2d? f1 : (real? . -> . real?) f2 : (real? . -> . real?) θ-min : rational? = 0 θ-max : rational? = (* 2 pi) x-min : (or/c rational? #f) = #f x-max : (or/c rational? #f) = #f y-min : (or/c rational? #f) = #f y-max : (or/c rational? #f) = #f samples : (and/c exact-integer? (>=/c 2)) = (line-samples) color : plot-color/c = (interval-color) style : plot-brush-style/c = (interval-style) line1-color : plot-color/c = (interval-line1-color) line1-width : (>=/c 0) = (interval-line1-width) line1-style : plot-pen-style/c = (interval-line1-style) line2-color : plot-color/c = (interval-line2-color) line2-width : (>=/c 0) = (interval-line2-width) line2-style : plot-pen-style/c = (interval-line2-style) alpha : (real-in 0 1) = (interval-alpha) label : (or/c string? #f) = #f
> (define (f1 θ) (+ 1/2 (* 1/6 (cos (* 5 θ)))))
> (define (f2 θ) (+ 1 (* 1/4 (cos (* 10 θ)))))
> (plot (list (polar-axes #:number 10) (polar-interval f1 f2 #:label "[f1,f2]")))
3.5 2D Contour (Isoline) Renderers
(isoline f z [ x-min x-max y-min y-max #:samples samples #:color color #:width width #:style style #:alpha alpha #:label label]) → renderer2d? f : (real? real? . -> . real?) z : real? x-min : (or/c rational? #f) = #f x-max : (or/c rational? #f) = #f y-min : (or/c rational? #f) = #f y-max : (or/c rational? #f) = #f samples : (and/c exact-integer? (>=/c 2)) = (contour-samples) color : plot-color/c = (line-color) width : (>=/c 0) = (line-width) style : plot-pen-style/c = (line-style) alpha : (real-in 0 1) = (line-alpha) label : (or/c string? #f) = #f
This function would have been named contour, except the name was already used by a deprecated function. It may be renamed in the future, with isoline as an alias.
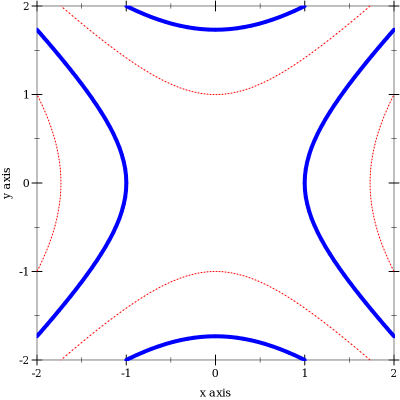
(contours f [ x-min x-max y-min y-max #:samples samples #:levels levels #:colors colors #:widths widths #:styles styles #:alphas alphas #:label label]) → renderer2d? f : (real? real? . -> . real?) x-min : (or/c rational? #f) = #f x-max : (or/c rational? #f) = #f y-min : (or/c rational? #f) = #f y-max : (or/c rational? #f) = #f samples : (and/c exact-integer? (>=/c 2)) = (contour-samples)
levels : (or/c 'auto exact-positive-integer? (listof real?)) = (contour-levels) colors : (plot-colors/c (listof real?)) = (contour-colors) widths : (pen-widths/c (listof real?)) = (contour-widths) styles : (plot-pen-styles/c (listof real?)) = (contour-styles) alphas : (alphas/c (listof real?)) = (contour-alphas) label : (or/c string? #f) = #f
When levels is 'auto, the number of contour lines and their values are chosen the same way as axis tick positions; i.e. they are chosen to be simple. When levels is a number, contours chooses that number of values, evenly spaced, within the output range of f. When levels is a list, contours plots contours at the values in levels.
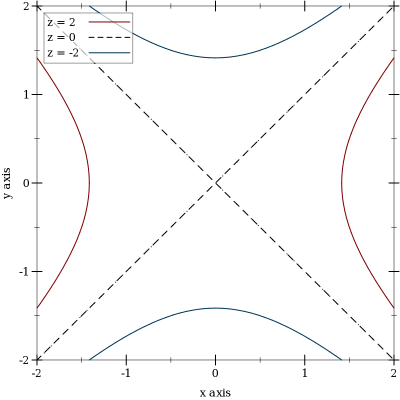
The appearance keyword arguments assign a color, width, style and opacity to each contour line. Each can be given as a list or as a function from a list of output values of f to a list of appearance values. In both cases, when there are more contour lines than list elements, the colors, widths, styles and alphas in the list repeat.
> (plot (contours (λ (x y) (- (sqr x) (sqr y))) -2 2 -2 2 #:levels 4 #:colors '("blue" "red") #:widths '(4 1) #:styles '(solid dot)))
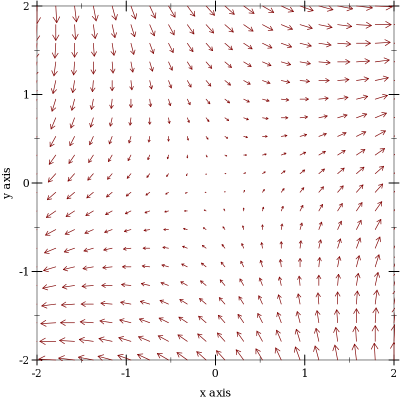
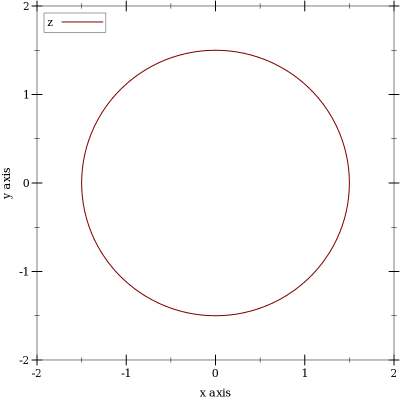
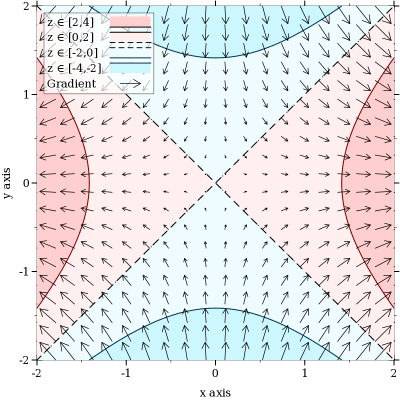
(contour-intervals f [ x-min x-max y-min y-max #:samples samples #:levels levels #:colors colors #:styles styles #:contour-colors contour-colors #:contour-widths contour-widths #:contour-styles contour-styles #:alphas alphas #:label label]) → renderer2d? f : (real? real? . -> . real?) x-min : (or/c rational? #f) = #f x-max : (or/c rational? #f) = #f y-min : (or/c rational? #f) = #f y-max : (or/c rational? #f) = #f samples : (and/c exact-integer? (>=/c 2)) = (contour-samples)
levels : (or/c 'auto exact-positive-integer? (listof real?)) = (contour-levels)
colors : (plot-colors/c (listof ivl?)) = (contour-interval-colors)
styles : (plot-brush-styles/c (listof ivl?)) = (contour-interval-styles)
contour-colors : (plot-colors/c (listof real?)) = (contour-colors)
contour-widths : (pen-widths/c (listof real?)) = (contour-widths)
contour-styles : (plot-pen-styles/c (listof real?)) = (contour-styles) alphas : (alphas/c (listof ivl?)) = (contour-interval-alphas) label : (or/c string? #f) = #f
> (plot (list (contour-intervals (λ (x y) (- (sqr x) (sqr y))) -2 2 -2 2 #:label "z") (vector-field (λ (x y) (vector (* 2 x) (* -2 y))) #:color "black" #:label "Gradient")))
3.6 2D Rectangle Renderers
(rectangles rects [ #:x-min x-min #:x-max x-max #:y-min y-min #:y-max y-max #:color color #:style style #:line-color line-color #:line-width line-width #:line-style line-style #:alpha alpha #:label label]) → renderer2d? rects : (listof (vector/c ivl? ivl?)) x-min : (or/c rational? #f) = #f x-max : (or/c rational? #f) = #f y-min : (or/c rational? #f) = #f y-max : (or/c rational? #f) = #f color : plot-color/c = (rectangle-color) style : plot-brush-style/c = (rectangle-style) line-color : plot-color/c = (rectangle-line-color) line-width : (>=/c 0) = (rectangle-line-width) line-style : plot-pen-style/c = (rectangle-line-style) alpha : (real-in 0 1) = (rectangle-alpha) label : (or/c string? #f) = #f
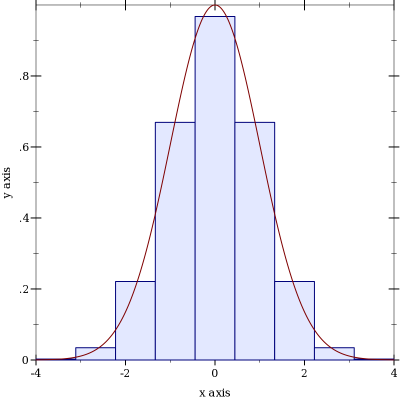
(area-histogram f bin-bounds [ #:x-min x-min #:x-max x-max #:y-min y-min #:y-max y-max #:samples samples #:color color #:style style #:line-color line-color #:line-width line-width #:line-style line-style #:alpha alpha #:label label]) → renderer2d? f : (real? . -> . real?) bin-bounds : (listof real?) x-min : (or/c rational? #f) = #f x-max : (or/c rational? #f) = #f y-min : (or/c rational? #f) = 0 y-max : (or/c rational? #f) = #f samples : (and/c exact-integer? (>=/c 2)) = (line-samples) color : plot-color/c = (rectangle-color) style : plot-brush-style/c = (rectangle-style) line-color : plot-color/c = (rectangle-line-color) line-width : (>=/c 0) = (rectangle-line-width) line-style : plot-pen-style/c = (rectangle-line-style) alpha : (real-in 0 1) = (rectangle-alpha) label : (or/c string? #f) = #f
> (require (only-in plot/utils linear-seq))
> (define (f x) (exp (* -1/2 (sqr x))))
> (plot (list (area-histogram f (linear-seq -4 4 10)) (function f -4 4)))
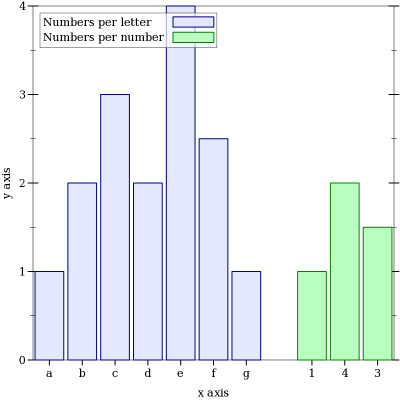
(discrete-histogram cat-vals [ #:x-min x-min #:x-max x-max #:y-min y-min #:y-max y-max #:gap gap #:skip skip #:invert? invert? #:color color #:style style #:line-color line-color #:line-width line-width #:line-style line-style #:alpha alpha #:label label #:far-ticks? far-ticks?]) → renderer2d? cat-vals : (listof (vector/c any/c (or/c real? ivl? #f))) x-min : (or/c rational? #f) = 0 x-max : (or/c rational? #f) = #f y-min : (or/c rational? #f) = 0 y-max : (or/c rational? #f) = #f gap : (real-in 0 1) = (discrete-histogram-gap) skip : (>=/c 0) = (discrete-histogram-skip) invert? : boolean? = (discrete-histogram-invert?) color : plot-color/c = (rectangle-color) style : plot-brush-style/c = (rectangle-style) line-color : plot-color/c = (rectangle-line-color) line-width : (>=/c 0) = (rectangle-line-width) line-style : plot-pen-style/c = (rectangle-line-style) alpha : (real-in 0 1) = (rectangle-alpha) label : (or/c string? #f) = #f far-ticks? : boolean? = #f
> (plot (list (discrete-histogram (list #(a 1) #(b 2) #(c 3) #(d 2) #(e 4) #(f 2.5) #(g 1)) #:label "Numbers per letter") (discrete-histogram (list #(1 1) #(4 2) #(3 1.5)) #:x-min 8 #:color 2 #:line-color 2 #:label "Numbers per number")))
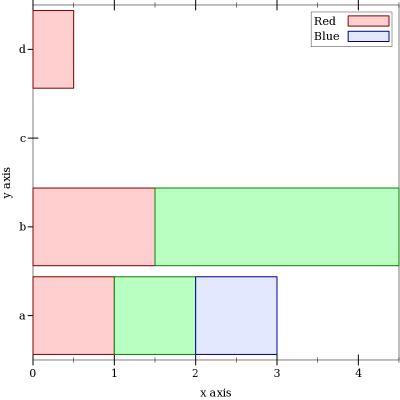
(stacked-histogram cat-vals [ #:x-min x-min #:x-max x-max #:y-min y-min #:y-max y-max #:gap gap #:skip skip #:invert? invert? #:colors colors #:styles styles #:line-colors line-colors #:line-widths line-widths #:line-styles line-styles #:alphas alphas #:labels labels #:far-ticks? far-ticks?]) → (listof renderer2d?) cat-vals : (listof (vector/c any/c (listof real?))) x-min : (or/c rational? #f) = 0 x-max : (or/c rational? #f) = #f y-min : (or/c rational? #f) = 0 y-max : (or/c rational? #f) = #f gap : (real-in 0 1) = (discrete-histogram-gap) skip : (>=/c 0) = (discrete-histogram-skip) invert? : boolean? = (discrete-histogram-invert?) colors : (plot-colors/c nat/c) = (stacked-histogram-colors)
styles : (plot-brush-styles/c nat/c) = (stacked-histogram-styles)
line-colors : (plot-colors/c nat/c) = (stacked-histogram-line-colors)
line-widths : (pen-widths/c nat/c) = (stacked-histogram-line-widths)
line-styles : (plot-pen-styles/c nat/c) = (stacked-histogram-line-styles) alphas : (alphas/c nat/c) = (stacked-histogram-alphas) labels : (labels/c nat/c) = '(#f) far-ticks? : boolean? = #f
Example: | |||||||
|
3.7 2D Plot Decoration Renderers
(x-axis [ y #:ticks? ticks? #:labels? labels? #:far? far? #:alpha alpha]) → renderer2d? y : real? = 0 ticks? : boolean? = (x-axis-ticks?) labels? : boolean? = (x-axis-labels?) far? : boolean? = (x-axis-far?) alpha : (real-in 0 1) = (x-axis-alpha)
(y-axis [ x #:ticks? ticks? #:labels? labels? #:far? far? #:alpha alpha]) → renderer2d? x : real? = 0 ticks? : boolean? = (y-axis-ticks?) labels? : boolean? = (y-axis-labels?) far? : boolean? = (y-axis-far?) alpha : (real-in 0 1) = (y-axis-alpha)
(axes [ x y #:x-ticks? x-ticks? #:y-ticks? y-ticks? #:x-labels? x-labels? #:y-labels? y-labels? #:x-alpha x-alpha #:y-alpha y-alpha]) → (listof renderer2d?) x : real? = 0 y : real? = 0 x-ticks? : boolean? = (x-axis-ticks?) y-ticks? : boolean? = (y-axis-ticks?) x-labels? : boolean? = (x-axis-labels?) y-labels? : boolean? = (y-axis-labels?) x-alpha : (real-in 0 1) = (x-axis-alpha) y-alpha : (real-in 0 1) = (y-axis-alpha)
(polar-axes [ #:number num #:ticks? ticks? #:labels? labels? #:alpha alpha]) → renderer2d? num : exact-nonnegative-integer? = (polar-axes-number) ticks? : boolean? = (polar-axes-ticks?) labels? : boolean? = (polar-axes-labels?) alpha : (real-in 0 1) = (polar-axes-alpha)
(tick-grid) → (listof renderer2d?)
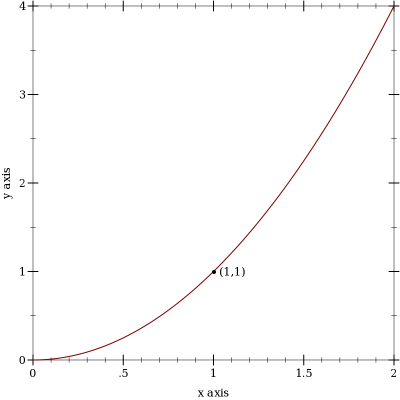
(point-label v [ label #:color color #:size size #:family family #:anchor anchor #:angle angle #:point-color point-color #:point-fill-color point-fill-color #:point-size point-size #:point-line-width point-line-width #:point-sym point-sym #:alpha alpha]) → renderer2d? v : (vector/c real? real?) label : (or/c string? #f) = #f color : plot-color/c = (plot-foreground) size : (>=/c 0) = (plot-font-size) family : font-family/c = (plot-font-family) anchor : anchor/c = (label-anchor) angle : real? = (label-angle) point-color : plot-color/c = (point-color) point-fill-color : (or/c plot-color/c 'auto) = 'auto point-size : (>=/c 0) = (label-point-size) point-line-width : (>=/c 0) = (point-line-width) point-sym : point-sym/c = 'fullcircle alpha : (real-in 0 1) = (label-alpha)
> (plot (list (function sqr 0 2) (point-label (vector 1 1))))
The remaining labeled-point functions are defined in terms of this one.
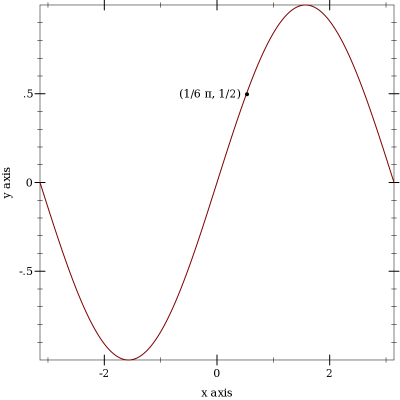
(function-label f x [ label #:color color #:size size #:family family #:anchor anchor #:angle angle #:point-color point-color #:point-fill-color point-fill-color #:point-size point-size #:point-line-width point-line-width #:point-sym point-sym #:alpha alpha]) → renderer2d? f : (real? . -> . real?) x : real? label : (or/c string? #f) = #f color : plot-color/c = (plot-foreground) size : (>=/c 0) = (plot-font-size) family : font-family/c = (plot-font-family) anchor : anchor/c = (label-anchor) angle : real? = (label-angle) point-color : plot-color/c = (point-color) point-fill-color : (or/c plot-color/c 'auto) = 'auto point-size : (>=/c 0) = (label-point-size) point-line-width : (>=/c 0) = (point-line-width) point-sym : point-sym/c = 'fullcircle alpha : (real-in 0 1) = (label-alpha)
> (plot (list (function sin (- pi) pi) (function-label sin (* 1/6 pi) "(1/6 π, 1/2)" #:anchor 'right)))
(inverse-label f y [ label #:color color #:size size #:family family #:anchor anchor #:angle angle #:point-color point-color #:point-fill-color point-fill-color #:point-size point-size #:point-line-width point-line-width #:point-sym point-sym #:alpha alpha]) → renderer2d? f : (real? . -> . real?) y : real? label : (or/c string? #f) = #f color : plot-color/c = (plot-foreground) size : (>=/c 0) = (plot-font-size) family : font-family/c = (plot-font-family) anchor : anchor/c = (label-anchor) angle : real? = (label-angle) point-color : plot-color/c = (point-color) point-fill-color : (or/c plot-color/c 'auto) = 'auto point-size : (>=/c 0) = (label-point-size) point-line-width : (>=/c 0) = (point-line-width) point-sym : point-sym/c = 'fullcircle alpha : (real-in 0 1) = (label-alpha)
(parametric-label f t [ label #:color color #:size size #:family family #:anchor anchor #:angle angle #:point-color point-color #:point-fill-color point-fill-color #:point-size point-size #:point-line-width point-line-width #:point-sym point-sym #:alpha alpha]) → renderer2d? f : (real? . -> . (vector/c real? real?)) t : real? label : (or/c string? #f) = #f color : plot-color/c = (plot-foreground) size : (>=/c 0) = (plot-font-size) family : font-family/c = (plot-font-family) anchor : anchor/c = (label-anchor) angle : real? = (label-angle) point-color : plot-color/c = (point-color) point-fill-color : (or/c plot-color/c 'auto) = 'auto point-size : (>=/c 0) = (label-point-size) point-line-width : (>=/c 0) = (point-line-width) point-sym : point-sym/c = 'fullcircle alpha : (real-in 0 1) = (label-alpha)
(polar-label f θ [ label #:color color #:size size #:family family #:anchor anchor #:angle angle #:point-color point-color #:point-fill-color point-fill-color #:point-size point-size #:point-line-width point-line-width #:point-sym point-sym #:alpha alpha]) → renderer2d? f : (real? . -> . real?) θ : real? label : (or/c string? #f) = #f color : plot-color/c = (plot-foreground) size : (>=/c 0) = (plot-font-size) family : font-family/c = (plot-font-family) anchor : anchor/c = (label-anchor) angle : real? = (label-angle) point-color : plot-color/c = (point-color) point-fill-color : (or/c plot-color/c 'auto) = 'auto point-size : (>=/c 0) = (label-point-size) point-line-width : (>=/c 0) = (point-line-width) point-sym : point-sym/c = 'fullcircle alpha : (real-in 0 1) = (label-alpha)