7 Plot and Renderer Parameters
7.1 Compatibility
(plot-deprecation-warnings?) → boolean? (plot-deprecation-warnings? warnings?) → void? warnings? : boolean? =
#f
7.2 Output
(plot-new-window?) → boolean? (plot-new-window? window?) → void? window? : boolean? =
#f
Users of command-line Racket, which cannot display image snips, should enter(plot-new-window? #t)
(plot-width) → exact-positive-integer? (plot-width width) → void? width : exact-positive-integer? =
400
(plot-height) → exact-positive-integer? (plot-height height) → void? height : exact-positive-integer? =
400
The width and height of a plot, in logical drawing units (e.g. pixels for bitmap plots).
(plot-jpeg-quality) → (integer-in 0 100) (plot-jpeg-quality quality) → void? quality : (integer-in 0 100) =
100
(plot-ps/pdf-interactive?) → boolean? (plot-ps/pdf-interactive? interactive?) → void? interactive? : boolean? =
#f
If #t, plot-file and plot3d-file open a dialog when writing PostScript or PDF files. See post-script-dc% and pdf-dc%.
7.3 Axis Transforms
(plot-x-transform) → (real? real? . -> . invertible-function?) (plot-x-transform transform) → void? transform : (real? real? . -> . invertible-function?) =
(plot-y-transform) → (real? real? . -> . invertible-function?) (plot-y-transform transform) → void? transform : (real? real? . -> . invertible-function?) =
(plot-z-transform) → (real? real? . -> . invertible-function?) (plot-z-transform transform) → void? transform : (real? real? . -> . invertible-function?) =
(id-transform x-min x-max) → invertible-function? x-min : real? x-max : real?
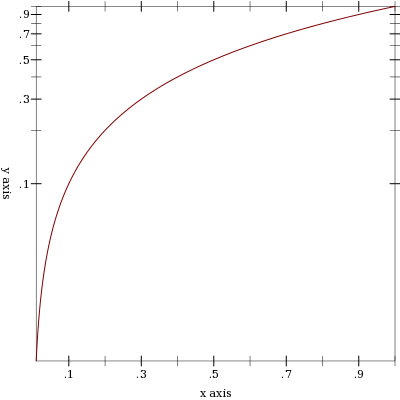
(log-transform x-min x-max) → invertible-function? x-min : real? x-max : real?
Examples: | |||||||||
|
(cbrt-transform x-min x-max) → invertible-function? x-min : real? x-max : real?
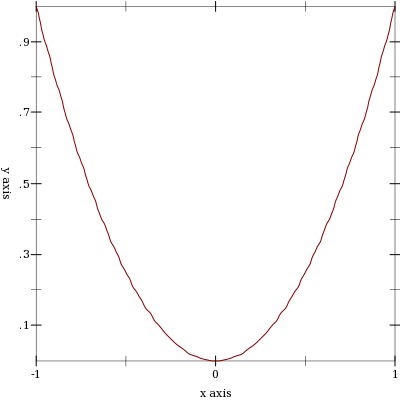
(hand-drawn-transform freq) → (real? real? . -> . invertible-function?) freq : (>/c 0)
The freq parameter controls the “shakiness” of the transform. At high values, it makes plots look like Peanuts cartoons. For example,
> (parameterize ([plot-x-transform (hand-drawn-transform 200)] [plot-y-transform (hand-drawn-transform 200)]) (plot (function sqr -1 1)))
7.4 General Appearance
(plot-foreground) → plot-color/c (plot-foreground color) → void? color : plot-color/c =
0
(plot-background) → plot-color/c (plot-background color) → void? color : plot-color/c =
0
The plot foreground and background color. That both are 0 by default is not a mistake: for foreground colors, 0 is interpreted as black; for background colors, 0 is interpreted as white. See ->pen-color and ->brush-color for details on how PLoT interprets integer colors.
(plot-foreground-alpha) → (real-in 0 1) (plot-foreground-alpha alpha) → void? alpha : (real-in 0 1) =
1
(plot-background-alpha) → (real-in 0 1) (plot-background-alpha alpha) → void? alpha : (real-in 0 1) =
1
The opacity of the background and foreground colors.
(plot-font-size) → (>=/c 0) (plot-font-size size) → void? size : (>=/c 0) =
11
The font size of the title, axis labels, tick labels, and other labels, in drawing units.
(plot-font-family) → font-family/c (plot-font-family family) → void? family : font-family/c =
'roman
The font family used for the title and labels.
(plot-line-width) → (>=/c 0) (plot-line-width width) → void? width : (>=/c 0) =
1
The width of axis lines and major tick lines. (Minor tick lines are half this width.)
(plot-legend-anchor) → anchor/c (plot-legend-anchor anchor) → void? anchor : anchor/c =
'top-right
Controls the placement of the legend.
(plot-legend-box-alpha) → (real-in 0 1) (plot-legend-box-alpha alpha) → void? alpha : (real-in 0 1) =
2/3
The opacity of the filled rectangle behind the legend entries.
(plot-tick-size) → (>=/c 0) (plot-tick-size size) → void? size : (>=/c 0) =
10
The length of tick lines, in drawing units.
(plot-title) → (or/c string? #f) (plot-title title) → void? title : (or/c string? #f) =
#f
(plot-x-label) → (or/c string? #f) (plot-x-label label) → void? label : (or/c string? #f) =
"x axis"
(plot-y-label) → (or/c string? #f) (plot-y-label label) → void? label : (or/c string? #f) =
"y axis"
(plot-z-label) → (or/c string? #f) (plot-z-label label) → void? label : (or/c string? #f) =
#f
The title and axis labels. A #f value means the label is not drawn and takes no space. A "" value effectively means the label is not drawn, but it takes space.
(plot-animating?) → boolean? (plot-animating? animating?) → void? animating? : boolean? =
#f
When #t, certain renderers draw simplified plots to speed up drawing. PLoT sets it to #t, for example, when a user is clicking and dragging a 3D plot to rotate it.
7.5 Lines
(line-samples) → (and/c exact-integer? (>=/c 2)) (line-samples samples) → void? samples : (and/c exact-integer? (>=/c 2)) =
500
(line-color) → plot-color/c (line-color color) → void? color : plot-color/c =
1
(line-width) → (>=/c 0) (line-width width) → void? width : (>=/c 0) =
1
(line-style) → plot-pen-style/c (line-style style) → void? style : plot-pen-style/c =
'solid
(line-alpha) → (real-in 0 1) (line-alpha alpha) → void? alpha : (real-in 0 1) =
1
7.6 Intervals
(interval-color) → plot-color/c (interval-color color) → void? color : plot-color/c =
3
(interval-style) → plot-brush-style/c (interval-style style) → void? style : plot-brush-style/c =
'solid
(interval-line1-color) → plot-color/c (interval-line1-color color) → void? color : plot-color/c =
3
(interval-line1-width) → (>=/c 0) (interval-line1-width width) → void? width : (>=/c 0) =
1
(interval-line1-style) → plot-pen-style/c (interval-line1-style style) → void? style : plot-pen-style/c =
'solid
(interval-line2-color) → plot-color/c (interval-line2-color color) → void? color : plot-color/c =
3
(interval-line2-width) → (>=/c 0) (interval-line2-width width) → void? width : (>=/c 0) =
1
(interval-line2-style) → plot-pen-style/c (interval-line2-style style) → void? style : plot-pen-style/c =
'solid
(interval-alpha) → (real-in 0 1) (interval-alpha alpha) → void? alpha : (real-in 0 1) =
3/4
7.7 Points
(point-sym) → point-sym/c (point-sym sym) → void? sym : point-sym/c =
'circle
(point-color) → plot-color/c (point-color color) → void? color : plot-color/c =
0
(point-size) → (>=/c 0) (point-size size) → void? size : (>=/c 0) =
6
(point-line-width) → (>=/c 0) (point-line-width width) → void? width : (>=/c 0) =
1
(point-alpha) → (real-in 0 1) (point-alpha alpha) → void? alpha : (real-in 0 1) =
1
7.8 Vector Fields
(vector-field-samples) → exact-positive-integer? (vector-field-samples samples) → void? samples : exact-positive-integer? =
20
(vector-field-color) → plot-color/c (vector-field-color color) → void? color : plot-color/c =
1
(vector-field-line-width) → (>=/c 0) (vector-field-line-width width) → void? width : (>=/c 0) =
2/3
(vector-field-line-style) → plot-pen-style/c (vector-field-line-style style) → void? style : plot-pen-style/c =
'solid
(vector-field-scale) → (or/c real? (one-of/c 'auto 'normalized)) (vector-field-scale scale) → void? scale : (or/c real? (one-of/c 'auto 'normalized)) =
'auto
(vector-field-alpha) → (real-in 0 1) (vector-field-alpha alpha) → void? alpha : (real-in 0 1) =
1
7.9 Error Bars
(error-bar-width) → (>=/c 0) (error-bar-width width) → void? width : (>=/c 0) =
6
(error-bar-color) → plot-color/c (error-bar-color color) → void? color : plot-color/c =
0
(error-bar-line-width) → (>=/c 0) (error-bar-line-width width) → void? width : (>=/c 0) =
1
(error-bar-line-style) → plot-pen-style/c (error-bar-line-style style) → void? style : plot-pen-style/c =
'solid
(error-bar-alpha) → (real-in 0 1) (error-bar-alpha alpha) → void? alpha : (real-in 0 1) =
2/3
7.10 Contours and Contour Intervals
(default-contour-colors zs) → (listof plot-color/c) zs : (listof real?)
(default-contour-fill-colors zs) → (listof plot-color/c) zs : (listof real?)
(contour-samples) → (and/c exact-integer? (>=/c 2)) (contour-samples samples) → void? samples : (and/c exact-integer? (>=/c 2)) =
51
(contour-levels) → (or/c 'auto exact-positive-integer? (listof real?)) (contour-levels levels) → void? levels : (or/c 'auto exact-positive-integer? (listof real?)) =
'auto
(contour-colors) → plot-colors/c (contour-colors colors) → void? colors : plot-colors/c =
(contour-widths) → pen-widths/c (contour-widths widths) → void? widths : pen-widths/c =
'(1)
(contour-styles) → plot-pen-styles/c (contour-styles styles) → void? styles : plot-pen-styles/c =
'(solid long-dash)
(contour-alphas) → alphas/c (contour-alphas alphas) → void? alphas : alphas/c =
'(1)
(contour-interval-colors) → plot-colors/c (contour-interval-colors colors) → void? colors : plot-colors/c =
(contour-interval-styles) → plot-brush-styles/c (contour-interval-styles styles) → void? styles : plot-brush-styles/c =
'(solid)
(contour-interval-alphas) → alphas/c (contour-interval-alphas alphas) → void? alphas : alphas/c =
'(1)
7.11 Rectangles
(rectangle-color) → plot-color/c (rectangle-color color) → void? color : plot-color/c =
3
(rectangle-style) → plot-brush-style/c (rectangle-style style) → void? style : plot-brush-style/c =
'solid
(rectangle-line-color) → plot-color/c (rectangle-line-color color) → void? color : plot-color/c =
3
(rectangle-line-width) → (>=/c 0) (rectangle-line-width width) → void? width : (>=/c 0) =
1
(rectangle-line-style) → plot-pen-style/c (rectangle-line-style style) → void? style : plot-pen-style/c =
'solid
(rectangle-alpha) → (real-in 0 1) (rectangle-alpha alpha) → void? alpha : (real-in 0 1) =
1
(rectangle3d-line-width) → (>=/c 0) (rectangle3d-line-width width) → void? width : (>=/c 0) =
1/3
(discrete-histogram-gap) → (real-in 0 1) (discrete-histogram-gap gap) → void? gap : (real-in 0 1) =
1/8
7.12 Decorations
These parameters do not control the typical appearance of plots. Instead, they control the look of renderers that add specific decorations, such as labeled points.
(x-axis-ticks?) → boolean? (x-axis-ticks? ticks?) → void? ticks? : boolean? =
#t
(y-axis-ticks?) → boolean? (y-axis-ticks? ticks?) → void? ticks? : boolean? =
#t
(z-axis-ticks?) → boolean? (z-axis-ticks? ticks?) → void? ticks? : boolean? =
#t
(polar-axes-number) → exact-positive-integer? (polar-axes-number number) → void? number : exact-positive-integer? =
12
(polar-axes-ticks?) → boolean? (polar-axes-ticks? ticks?) → void? ticks? : boolean? =
#t
(label-anchor) → anchor/c (label-anchor anchor) → void? anchor : anchor/c =
'left
(label-angle) → real? (label-angle angle) → void? angle : real? =
0
(label-alpha) → (real-in 0 1) (label-alpha alpha) → void? alpha : (real-in 0 1) =
1
(label-point-size) → (>=/c 0) (label-point-size size) → void? size : (>=/c 0) =
4
7.13 3D General Appearance
(plot3d-samples) → (and/c exact-integer? (>=/c 2)) (plot3d-samples samples) → void? samples : (and/c exact-integer? (>=/c 2)) =
41
(plot3d-angle) → real? (plot3d-angle angle) → void? angle : real? =
30
(plot3d-altitude) → real? (plot3d-altitude altitude) → void? altitude : real? =
60
(plot3d-ambient-light) → (real-in 0 1) (plot3d-ambient-light light) → void? light : (real-in 0 1) =
2/3
(plot3d-diffuse-light?) → boolean? (plot3d-diffuse-light? light?) → void? light? : boolean? =
#t
(plot3d-specular-light?) → boolean? (plot3d-specular-light? light?) → void? light? : boolean? =
#t
7.14 Surfaces
(surface-color) → plot-color/c (surface-color color) → void? color : plot-color/c =
0
(surface-style) → plot-brush-style/c (surface-style style) → void? style : plot-brush-style/c =
'solid
(surface-line-color) → plot-color/c (surface-line-color color) → void? color : plot-color/c =
0
(surface-line-width) → (>=/c 0) (surface-line-width width) → void? width : (>=/c 0) =
1/3
(surface-line-style) → plot-pen-style/c (surface-line-style style) → void? style : plot-pen-style/c =
'solid
(surface-alpha) → (real-in 0 1) (surface-alpha alpha) → void? alpha : (real-in 0 1) =
1
7.15 Contour Surfaces
Contour surface renderers use shared contour parameters except for the following three.
(contour-interval-line-colors) → plot-colors/c (contour-interval-line-colors colors) → void? colors : plot-colors/c =
'(0)
(contour-interval-line-widths) → pen-widths/c (contour-interval-line-widths widths) → void? widths : pen-widths/c =
'(1/3)
(contour-interval-line-styles) → plot-pen-styles/c (contour-interval-line-styles styles) → void? styles : plot-pen-styles/c =
'(solid)
7.16 Isosurfaces
Single isosurfaces (isosurface3d) use surface parameters. Nested isosurfaces (isosurfaces3d) use the following.
(default-isosurface-colors zs) → (listof plot-color/c) zs : (listof real?)
(default-isosurface-line-colors zs) → (listof plot-color/c) zs : (listof real?)
(isosurface-levels) → exact-positive-integer? (isosurface-levels levels) → void? levels : exact-positive-integer? =
3
(isosurface-colors) → plot-colors/c (isosurface-colors colors) → void? colors : plot-colors/c =
(isosurface-line-colors) → plot-colors/c (isosurface-line-colors colors) → void? colors : plot-colors/c =
(isosurface-line-widths) → pen-widths/c (isosurface-line-widths widths) → void? widths : pen-widths/c =
'(1/3)
(isosurface-line-styles) → plot-pen-styles/c (isosurface-line-styles styles) → void? styles : plot-pen-styles/c =
'(solid)
(isosurface-alphas) → alphas/c (isosurface-alphas alphas) → void? alphas : alphas/c =
'(1/2)