Version: 5.2
5 3D Renderers
(renderer3d? value) → boolean? value : any/c
Returns #t if value is a 3D renderer; that is, if plot3d can plot value.
The following functions create such renderers.
5.1 3D Renderer Function Arguments
As with functions that return 2D renderers, functions that return 3D renderers always have these kinds of arguments:
Required (and possibly optional) arguments representing the graph to plot.
Optional keyword arguments for overriding calculated bounds, with the default value #f.
Optional keyword arguments that determine the appearance of the plot.
The optional keyword argument #:label, which specifies the name of the renderer in the legend.
See 2D Renderer Function Arguments for a detailed example.
5.2 3D Point Renderers
(points3d vs [ #:x-min x-min #:x-max x-max #:y-min y-min #:y-max y-max #:z-min z-min #:z-max z-max #:sym sym #:color color #:size size #:line-width line-width #:alpha alpha #:label label]) → renderer3d? vs : (listof (vector/c real? real? real?)) x-min : (or/c real? #f) = #f x-max : (or/c real? #f) = #f y-min : (or/c real? #f) = #f y-max : (or/c real? #f) = #f z-min : (or/c real? #f) = #f z-max : (or/c real? #f) = #f sym : point-sym/c = (point-sym) color : plot-color/c = (point-color) size : (>=/c 0) = (point-size) line-width : (>=/c 0) = (point-line-width) alpha : (real-in 0 1) = (point-alpha) label : (or/c string? #f) = #f
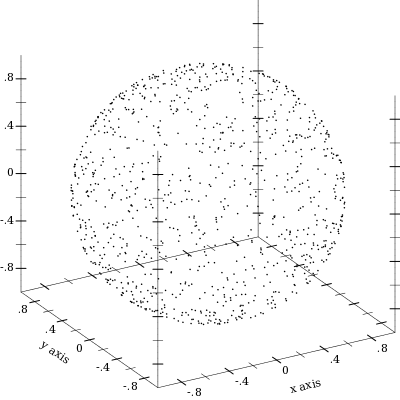
Returns a renderer that draws points in 3D space.
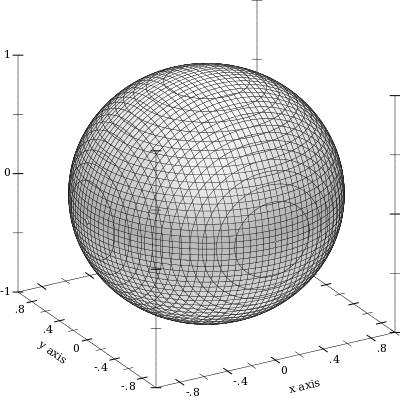
For example, a scatter plot of points sampled uniformly from the surface of a sphere:
> (let () (define (runif) (- (* 2 (random)) 1)) (define (rnormish) (+ (runif) (runif) (runif) (runif))) (define xs0 (build-list 1000 (λ _ (rnormish)))) (define ys0 (build-list 1000 (λ _ (rnormish)))) (define zs0 (build-list 1000 (λ _ (rnormish)))) (define mags (map (λ (x y z) (sqrt (+ (sqr x) (sqr y) (sqr z)))) xs0 ys0 zs0)) (define xs (map / xs0 mags)) (define ys (map / ys0 mags)) (define zs (map / zs0 mags)) (plot3d (points3d (map vector xs ys zs) #:sym 'dot) #:altitude 25))
5.3 3D Line Renderers
(lines3d vs [ #:x-min x-min #:x-max x-max #:y-min y-min #:y-max y-max #:z-min z-min #:z-max z-max #:color color #:width width #:style style #:alpha alpha #:label label]) → renderer3d? vs : (listof (vector/c real? real? real?)) x-min : (or/c real? #f) = #f x-max : (or/c real? #f) = #f y-min : (or/c real? #f) = #f y-max : (or/c real? #f) = #f z-min : (or/c real? #f) = #f z-max : (or/c real? #f) = #f color : plot-color/c = (line-color) width : (>=/c 0) = (line-width) style : plot-pen-style/c = (line-style) alpha : (real-in 0 1) = (line-alpha) label : (or/c string? #f) = #f
Returns a renderer that draws connected lines, with points in 3D space.
(parametric3d f t-min t-max [ #:x-min x-min #:x-max x-max #:y-min y-min #:y-max y-max #:z-min z-min #:z-max z-max #:samples samples #:color color #:width width #:style style #:alpha alpha #:label label]) → renderer3d? f : (real? . -> . (vector/c real? real? real?)) t-min : real? t-max : real? x-min : (or/c real? #f) = #f x-max : (or/c real? #f) = #f y-min : (or/c real? #f) = #f y-max : (or/c real? #f) = #f z-min : (or/c real? #f) = #f z-max : (or/c real? #f) = #f samples : (and/c exact-integer? (>=/c 2)) = (line-samples) color : plot-color/c = (line-color) width : (>=/c 0) = (line-width) style : plot-pen-style/c = (line-style) alpha : (real-in 0 1) = (line-alpha) label : (or/c string? #f) = #f
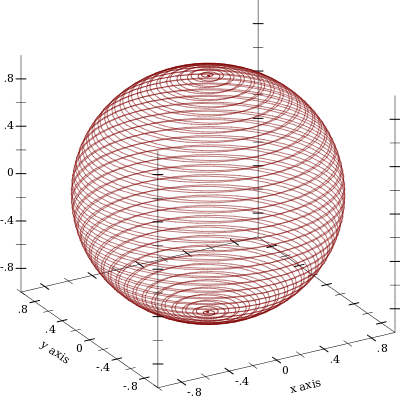
Returns a renderer that plots a vector-valued function of time. For example,
> (plot3d (parametric3d (λ (t) (vector (* (cos (* 80 t)) (cos t)) (* (sin (* 80 t)) (cos t)) (sin t))) (- pi) pi #:samples 3000 #:alpha 0.5) #:altitude 25)
5.4 3D Surface Renderers
(surface3d f [ x-min x-max y-min y-max #:z-min z-min #:z-max z-max #:samples samples #:color color #:style style #:line-color line-color #:line-width line-width #:line-style line-style #:alpha alpha #:label label]) → renderer3d? f : (real? real? . -> . real?) x-min : (or/c real? #f) = #f x-max : (or/c real? #f) = #f y-min : (or/c real? #f) = #f y-max : (or/c real? #f) = #f z-min : (or/c real? #f) = #f z-max : (or/c real? #f) = #f samples : (and/c exact-integer? (>=/c 2)) = (plot3d-samples) color : plot-color/c = (surface-color) style : plot-brush-style/c = (surface-style) line-color : plot-color/c = (surface-line-color) line-width : (>=/c 0) = (surface-line-width) line-style : plot-pen-style/c = (surface-line-style) alpha : (real-in 0 1) = (surface-alpha) label : (or/c string? #f) = #f
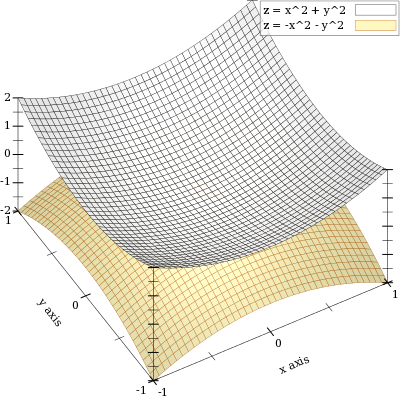
Returns a renderer that plots a two-input, one-output function. For example,
> (plot3d (list (surface3d (λ (x y) (+ (sqr x) (sqr y))) -1 1 -1 1 #:label "z = x^2 + y^2") (surface3d (λ (x y) (- (+ (sqr x) (sqr y)))) -1 1 -1 1 #:color 4 #:line-color 4 #:label "z = -x^2 - y^2")))
(polar3d f [ #:x-min x-min #:x-max x-max #:y-min y-min #:y-max y-max #:z-min z-min #:z-max z-max #:samples samples #:color color #:line-color line-color #:line-width line-width #:line-style line-style #:alpha alpha #:label label]) → renderer3d? f : (real? real? . -> . real?) x-min : (or/c real? #f) = #f x-max : (or/c real? #f) = #f y-min : (or/c real? #f) = #f y-max : (or/c real? #f) = #f z-min : (or/c real? #f) = #f z-max : (or/c real? #f) = #f samples : (and/c exact-integer? (>=/c 2)) = (plot3d-samples) color : plot-color/c = (surface-color) line-color : plot-color/c = (surface-line-color) line-width : (>=/c 0) = (surface-line-width) line-style : plot-pen-style/c = (surface-line-style) alpha : (real-in 0 1) = (surface-alpha) label : (or/c string? #f) = #f
Returns a renderer that plots a function from latitude and longitude to radius.
Currently, latitudes range from 0 to (* 2 pi), and longitudes from (* -1/2 pi) to (* 1/2 pi).
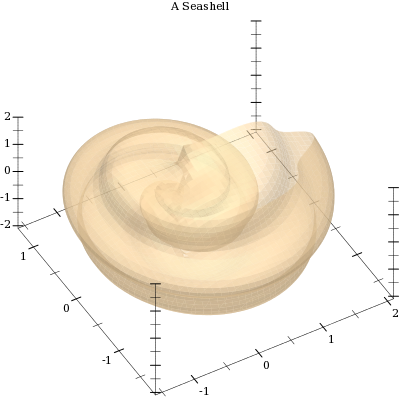
A sphere is the graph of a polar function of constant radius:
Combining polar function renderers allows faking latitudes or longitudes in larger ranges, to get, for example, a seashell plot:
> (let () (define (f1 θ ρ) (+ 1 (/ θ 2 pi) (* 1/8 (sin (* 8 ρ))))) (define (f2 θ ρ) (+ 0 (/ θ 2 pi) (* 1/8 (sin (* 8 ρ))))) (plot3d (list (polar3d f1 #:color "navajowhite" #:line-style 'transparent #:alpha 2/3) (polar3d f2 #:color "navajowhite" #:line-style 'transparent #:alpha 2/3)) #:title "A Seashell" #:x-label #f #:y-label #f))
5.5 3D Contour Renderers
(contours3d f [ x-min x-max y-min y-max #:z-min z-min #:z-max z-max #:levels levels #:samples samples #:colors colors #:widths widths #:styles styles #:alphas alphas #:label label]) → renderer3d? f : (real? real? . -> . real?) x-min : (or/c real? #f) = #f x-max : (or/c real? #f) = #f y-min : (or/c real? #f) = #f y-max : (or/c real? #f) = #f z-min : (or/c real? #f) = #f z-max : (or/c real? #f) = #f
levels : (or/c 'auto exact-positive-integer? (listof real?)) = (contour-levels) samples : (and/c exact-integer? (>=/c 2)) = (plot3d-samples) colors : plot-colors/c = (contour-colors) widths : pen-widths/c = (contour-widths) styles : plot-pen-styles/c = (contour-styles) alphas : alphas/c = (contour-alphas) label : (or/c string? #f) = #f
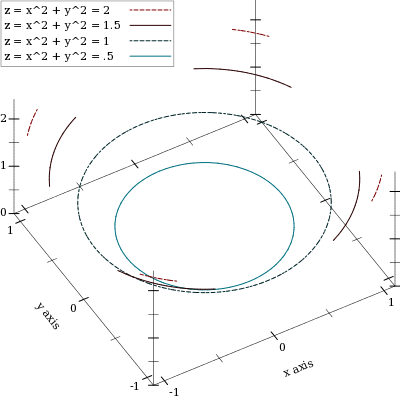
Returns a renderer that plots contour lines on the surface of a function.
The appearance keyword arguments are interpreted identically to the appearance keyword arguments to contours. In particular, when levels is 'auto, contour values correspond precisely to z axis ticks.
For example,
> (plot3d (contours3d (λ (x y) (+ (sqr x) (sqr y))) -1.1 1.1 -1.1 1.1 #:label "z = x^2 + y^2") #:legend-anchor 'top-left)
(contour-intervals3d f [ x-min x-max y-min y-max #:z-min z-min #:z-max z-max #:levels levels #:samples samples #:colors colors #:line-colors line-colors #:line-widths line-widths #:line-styles line-styles #:contour-colors contour-colors #:contour-widths contour-widths #:contour-styles contour-styles #:alphas alphas #:label label]) → renderer3d? f : (real? real? . -> . real?) x-min : (or/c real? #f) = #f x-max : (or/c real? #f) = #f y-min : (or/c real? #f) = #f y-max : (or/c real? #f) = #f z-min : (or/c real? #f) = #f z-max : (or/c real? #f) = #f
levels : (or/c 'auto exact-positive-integer? (listof real?)) = (contour-levels) samples : (and/c exact-integer? (>=/c 2)) = (plot3d-samples) colors : plot-colors/c = (contour-interval-colors) line-colors : plot-colors/c = (contour-interval-line-colors) line-widths : pen-widths/c = (contour-interval-line-widths)
line-styles : plot-pen-styles/c = (contour-interval-line-styles) contour-colors : plot-colors/c = (contour-colors) contour-widths : pen-widths/c = (contour-widths) contour-styles : plot-pen-styles/c = (contour-styles) alphas : alphas/c = (contour-interval-alphas) label : (or/c string? #f) = #f
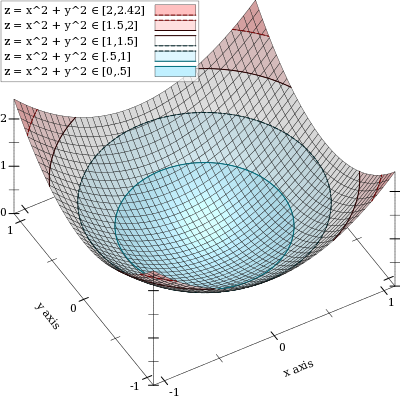
Returns a renderer that plots contour intervals and contour lines on the surface of a function.
The appearance keyword arguments are interpreted identically to the appearance keyword arguments to contour-intervals.
For example,
> (plot3d (contour-intervals3d (λ (x y) (+ (sqr x) (sqr y))) -1.1 1.1 -1.1 1.1 #:label "z = x^2 + y^2") #:legend-anchor 'top-left)
5.6 3D Isosurface Renderers
(isosurface3d f d [ x-min x-max y-min y-max z-min z-max #:samples samples #:color color #:line-color line-color #:line-width line-width #:line-style line-style #:alpha alpha #:label label]) → renderer3d? f : (real? real? real? . -> . real?) d : real? x-min : (or/c real? #f) = #f x-max : (or/c real? #f) = #f y-min : (or/c real? #f) = #f y-max : (or/c real? #f) = #f z-min : (or/c real? #f) = #f z-max : (or/c real? #f) = #f samples : (and/c exact-integer? (>=/c 2)) = (plot3d-samples) color : plot-color/c = (surface-color) line-color : plot-color/c = (surface-line-color) line-width : (>=/c 0) = (surface-line-width) line-style : plot-pen-style/c = (surface-line-style) alpha : (real-in 0 1) = (surface-alpha) label : (or/c string? #f) = #f
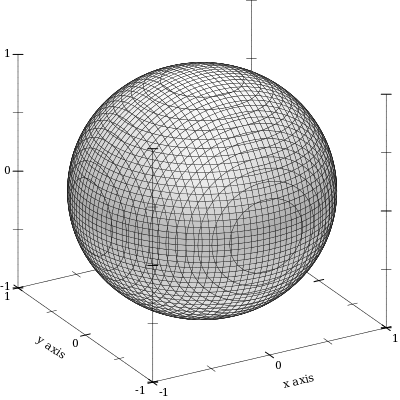
Returns a renderer that plots the surface of constant output value of the function f. The argument d is the constant value.
For example, a sphere is all the points in which the Euclidean distance function returns the sphere’s radius:
> (plot3d (isosurface3d (λ (x y z) (sqrt (+ (sqr x) (sqr y) (sqr z)))) 1 -1 1 -1 1 -1 1) #:altitude 25)
(isosurfaces3d f [ x-min x-max y-min y-max z-min z-max #:d-min d-min #:d-max d-max #:levels levels #:samples samples #:colors colors #:line-colors line-colors #:line-widths line-widths #:line-styles line-styles #:alphas alphas #:label label]) → renderer3d? f : (real? real? real? . -> . real?) x-min : (or/c real? #f) = #f x-max : (or/c real? #f) = #f y-min : (or/c real? #f) = #f y-max : (or/c real? #f) = #f z-min : (or/c real? #f) = #f z-max : (or/c real? #f) = #f d-min : (or/c real? #f) = #f d-max : (or/c real? #f) = #f levels : exact-positive-integer? = (isosurface-levels) samples : (and/c exact-integer? (>=/c 2)) = (plot3d-samples) colors : plot-colors/c = (isosurface-colors) line-colors : plot-colors/c = (isosurface-line-colors) line-widths : pen-widths/c = (isosurface-line-widths) line-styles : plot-pen-styles/c = (isosurface-line-styles) alphas : alphas/c = (isosurface-alphas) label : (or/c string? #f) = #f
Returns a renderer that plots multiple isosurfaces. The appearance keyword arguments are interpreted similarly to those of contours.
Use this to visualize functions from three inputs to one output; for example:
> (let () (define (saddle x y z) (- (sqr x) (* 1/2 (+ (sqr y) (sqr z))))) (plot3d (isosurfaces3d saddle #:d-min -1 #:d-max 1 #:label "") #:x-min -2 #:x-max 2 #:y-min -2 #:y-max 2 #:z-min -2 #:z-max 2 #:legend-anchor 'top-left))
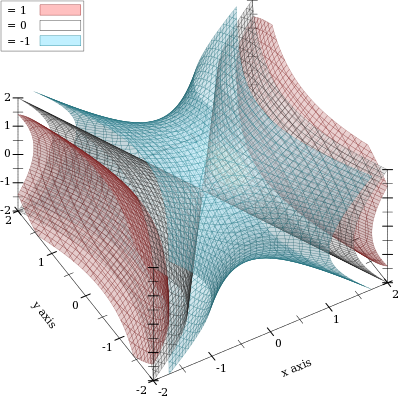
If it helps, think of the output of f as a density or charge.
5.7 3D Rectangle Renderers
(rectangles3d rects [ #:x-min x-min #:x-max x-max #:y-min y-min #:y-max y-max #:z-min z-min #:z-max z-max #:color color #:style style #:line-color line-color #:line-width line-width #:line-style line-style #:alpha alpha #:label label]) → renderer3d? rects : (listof (vector/c ivl? ivl? ivl?)) x-min : (or/c real? #f) = #f x-max : (or/c real? #f) = #f y-min : (or/c real? #f) = #f y-max : (or/c real? #f) = #f z-min : (or/c real? #f) = #f z-max : (or/c real? #f) = #f color : plot-color/c = (rectangle-color) style : plot-brush-style/c = (rectangle-style) line-color : plot-color/c = (rectangle-line-color) line-width : (>=/c 0) = (rectangle3d-line-width) line-style : plot-pen-style/c = (rectangle-line-style) alpha : (real-in 0 1) = (rectangle-alpha) label : (or/c string? #f) = #f
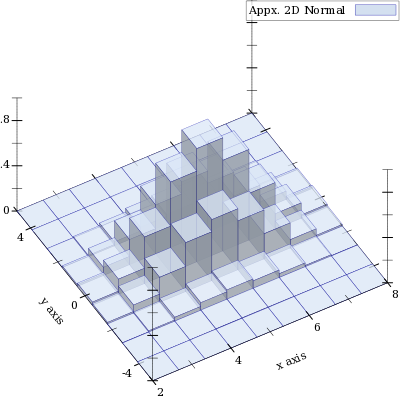
Returns a renderer that draws rectangles.
This can be used to draw histograms; for example,
> (let () (define (norm2 x y) (exp (* -1/2 (+ (sqr (- x 5)) (sqr y))))) (define x-ivls (bounds->intervals (linear-seq 2 8 10))) (define y-ivls (bounds->intervals (linear-seq -5 5 10))) (define x-mids (linear-seq 2 8 9 #:start? #f #:end? #f)) (define y-mids (linear-seq -5 5 9 #:start? #f #:end? #f)) (plot3d (rectangles3d (append* (for/list ([y-ivl (in-list y-ivls)] [y (in-list y-mids)]) (for/list ([x-ivl (in-list x-ivls)] [x (in-list x-mids)]) (define z (norm2 x y)) (vector x-ivl y-ivl (ivl 0 z))))) #:alpha 3/4 #:label "Appx. 2D Normal")))
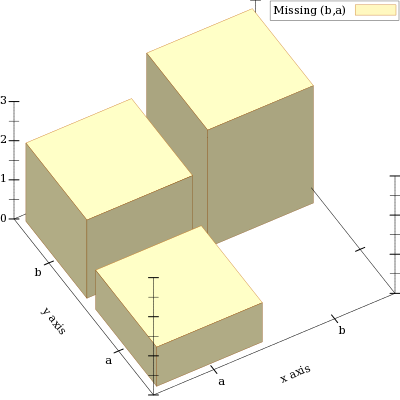
(discrete-histogram3d cat-vals [ #:x-min x-min #:x-max x-max #:y-min y-min #:y-max y-max #:z-min z-min #:z-max z-max #:gap gap #:color color #:style style #:line-color line-color #:line-width line-width #:line-style line-style #:alpha alpha #:label label]) → renderer3d? cat-vals : (listof (vector/c any/c any/c real?)) x-min : (or/c real? #f) = 0 x-max : (or/c real? #f) = #f y-min : (or/c real? #f) = 0 y-max : (or/c real? #f) = #f z-min : (or/c real? #f) = 0 z-max : (or/c real? #f) = #f gap : (real-in 0 1) = (discrete-histogram-gap) color : plot-color/c = (rectangle-color) style : plot-brush-style/c = (rectangle-style) line-color : plot-color/c = (rectangle-line-color) line-width : (>=/c 0) = (rectangle3d-line-width) line-style : plot-pen-style/c = (rectangle-line-style) alpha : (real-in 0 1) = (rectangle-alpha) label : (or/c string? #f) = #f
Returns a renderer that draws discrete histograms on a two-valued domain.
Missing pairs are not drawn; for example,
> (plot3d (discrete-histogram3d '(#(a a 1) #(a b 2) #(b b 3)) #:label "Missing (b,a)" #:color 4 #:line-color 4))