Version: 5.2
6 Plot Utilities
Converts degrees to radians.
Converts radians to degrees.
Given a range, returns the number of decimal places necessary to distinguish numbers in the range. This may return negative numbers for large ranges.
Converts a real number to a plot label. Used to format axis tick labels,
point-labels, and numbers in legend entries.
Returns a list of evenly spaced real numbers between start and end.
If start? is #t, the list includes start.
If end? is #t, the list includes end.
This function is used internally to generate sample points.
Examples: |
| > (linear-seq 0 1 5) | '(0 1/4 1/2 3/4 1) | | > (linear-seq 0 1 5 #:start? #f) | '(1/9 1/3 5/9 7/9 1) | | > (linear-seq 0 1 5 #:end? #f) | '(0 2/9 4/9 2/3 8/9) | | > (linear-seq 0 1 5 #:start? #f #:end? #f) | '(1/10 3/10 1/2 7/10 9/10) |
|
Like
linear-seq, but accepts a list of reals instead of a start and end.
The
#:start? and
#:end? keyword arguments work as in
linear-seq.
This function does not guarantee that each inner value will be in the returned list.
Given a list of points, returns intervals between each pair.
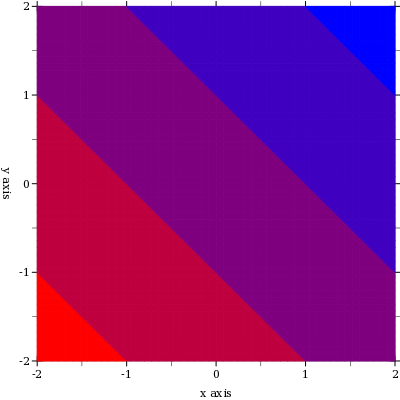
Interpolates between colors—
red, green and blue components separately—
using
linear-seq.
The
#:start? and
#:end? keyword arguments work as in
linear-seq.
Interpolates between colors—
red, green and blue components separately—
using
linear-seq*.
The
#:start? and
#:end? keyword arguments work as in
linear-seq.
Converts a non-integer plot color to an RGB triplet.
Symbols are converted to strings, and strings are looked up in a color-database<%>.
Lists are unchanged, and color% objects are converted straightforwardly.
This function does not convert integers to RGB triplets, because there is no way for it to know whether the color will be used for a pen or for a brush.
Use ->pen-color and ->brush-color to convert integers.
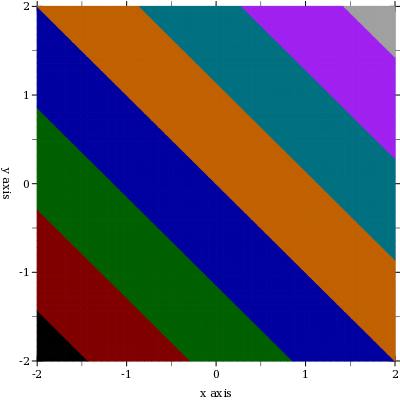
Converts a
line color to an RGB triplet. This function interprets integer colors as darker and more saturated than
->brush-color does.
Non-integer colors are converted using ->color.
Integer colors are chosen for good pairwise contrast, especially between neighbors.
Integer colors repeat starting with 8.
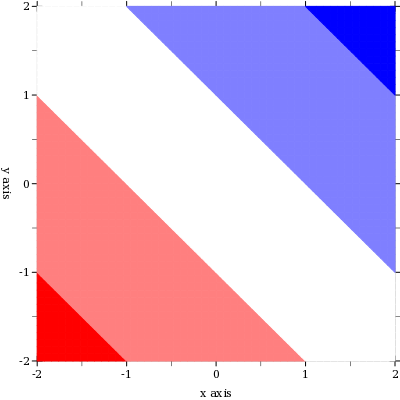
Converts a
fill color to an RGB triplet. This function interprets integer colors as lighter and less saturated than
->pen-color does.
Non-integer colors are converted using ->color.
Integer colors are chosen for good pairwise contrast, especially between neighbors.
Integer colors repeat starting with 8.
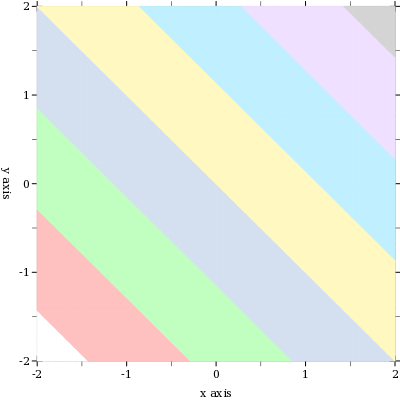
In the above example, mapping ->brush-color over the list is actually unnecessary, because contour-intervals uses ->brush-color internally to convert fill colors.
The
function-interval function generally plots areas using a fill color and lines using a line color.
Both kinds of color have the default value
3.
The following example reverses the default behavior; i.e it draws areas using
line color
3 and lines using
fill color
3:
Converts a symbolic pen style or a number to a symbolic pen style.
Symbols are unchanged.
Integer pen styles repeat starting at 5.
Converts a symbolic brush style or a number to a symbolic brush style.
Symbols are unchanged.
Integer brush styles repeat starting at 7.
Represents an invertible function.
The function itself is f, and its inverse is finv.
Because real?s can be inexact, this invariant must be approximate and therefore cannot be enforced.
(For example, (exp (log 10)) = 10.000000000000002.)
The obligation to maintain it rests on whomever constructs one.
An axis transform such as plot-x-transform is a function from bounds start end to an invertible-function for which (f start) = start and (f end) = end (approximately), and the same is true of finv.
The function f is used to transform points before drawing; its inverse finv is used to generate samples that will be evenly spaced after being transformed by f.
(Technically, because of the way PLoT uses invertible-function, f must only be a left inverse of finv; there is no requirement that f also be a right inverse of finv.)
Generates a list of reals that, if transformed using transform, would be evenly spaced.
This is used to generate samples for transformed axes.
Represents a function that maps over lists differently than
(map f xs).
With some functions, mapping over a list can be done much more quickly if done specially.
(An example is a piecewise function with many pieces that first must decide which interval its input belongs to. Deciding that for many inputs can be done more efficiently by sorting all the inputs first.)
Renderer-producing functions that accept a (-> real? real?) also accept a mapped-function, and use its fmap to sample more efficiently.
Given samples and a kernel bandwidth, returns a
mapped-function representing a kernel density estimate, and bounds, outside of which the density estimate is zero. Used by
density.